- WeekendInvesting
- Posts
- April-June : Strongest Phase for the Market Returns ?
April-June : Strongest Phase for the Market Returns ?
Or its time to move to Cash ?
WeekendInvesting Analytics
April 09, 2026

Market Update - Thursday, 9 Apr
Contrary to expectations, the market did drop a bit, but only in stocks which had run up quite a bit yesterday. Yesterday, the gap up caused a lot of stocks to move up very, very rapidly and significant profit booking only came in those stocks. Stocks that had been rising even earlier continued to rise, resulting in a very mixed bag signal from the market where some stocks are really flying and others were completely under pressure.
Let's look at some of the charts, and please do read the disclaimer. A chart from Bar Chart provides a global measure of what cash is doing in US markets, showing that investors are rotating to cash at one of the fastest paces. It is well known that when retail investors move into cash, that probably signals some sort of bottoming out as well.
If you look at the Nifty chart, Nifty had a very tight range yesterday after a huge gap up. Today, it did come below yesterday's low, but the range remained very tight even today, ending at minus 0.93% from yesterday. There is no real harm done so far, and the short-term outlook remains bullish on the markets in this scenario.
Nifty Jr., on the other hand, did correct but closed higher at 0.19%, which is very positive.
Mid-caps were also up 0.27% and Small-caps were up 0.13%.
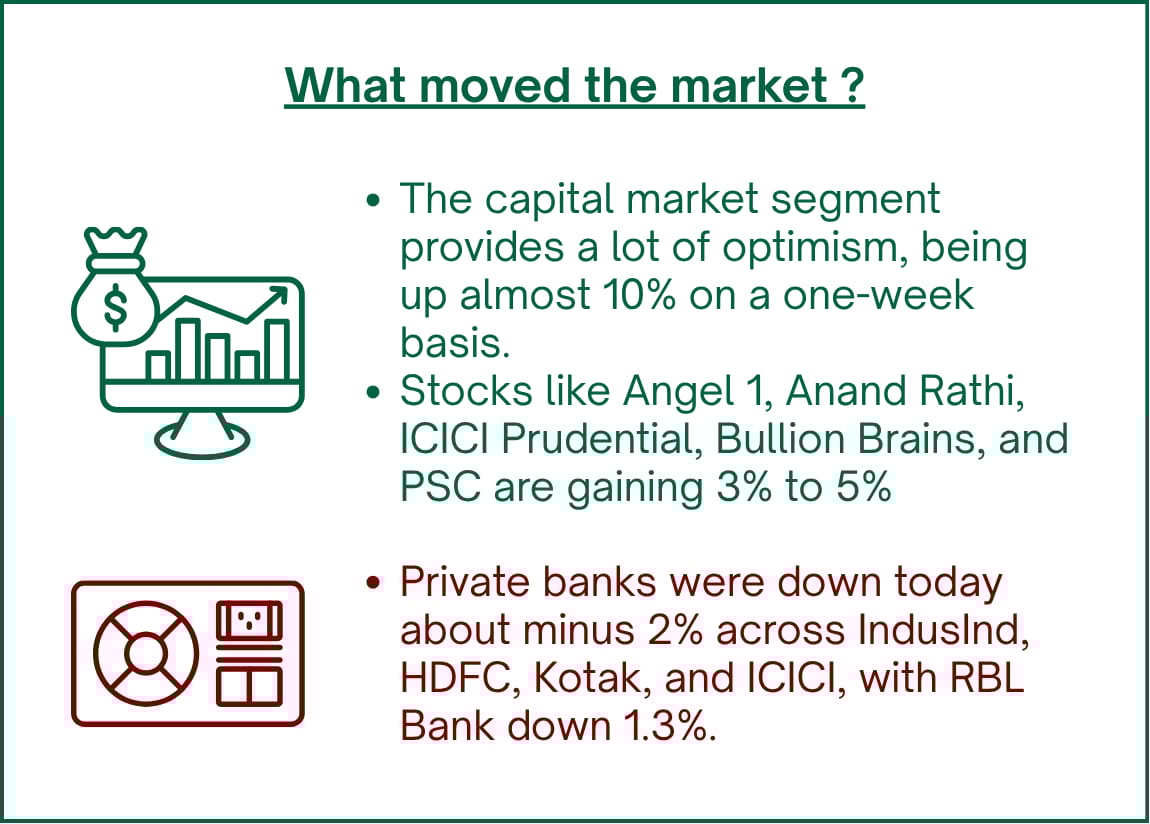
However, banking stocks were down, giving up pretty much yesterday's range at minus 1.58%. This occurred because yesterday saw an exhaustion gap of almost 3% or 4% following three days of gain.
Gold is flat.
While there is some correction from the sharp fall in oil, it does not mean it will go straight back up unless ceasefire talks break down.
Other Market Triggers
Most losses came from stocks that were flying hard yesterday.
HDFC Bank was up 5% to 6% yesterday, and State Bank, LT, and ICICI Bank also saw significant gains before these corrective moves.
In the Nifty Next 50 space, DLF, Ambuja Cements, Indian Hotels, and Canara Bank moved off a bit, while nice gains were seen in Vedanta, Hindustan Aeronautics, Torrent Pharma, and VFC.
In the movers of the day segment, Ola is going bonkers, quickly scaling from nearly 22 or 23 rupees to 36 rupees due to an announcement regarding lithium cell capacity creation.
HFCL was also up 6% after its subsidiary bagged a big optical fiber order. Looking at sectoral trends, the market is evenly matched.
U.S. Market Updates
In the previous session of US markets, all indices were up significantly by 2.5% to 3%. There were gains in Meta, Amazon, Walmart, Google, ASML, MU, AMD, Intel, and AVGO.
Some of these stocks could be part of the Weekend Investing stock strategy. Conversely, Palantir dropped 6.2% and Tesla continued to drop very hard.
What to watch next ?
The market may consolidate here, but it is unlikely to fall flat on its face just based on geopolitics.
There are some concerns as crude oil has moved up again, reaching 98 after being near 90 yesterday.
Regarding War scenario, The first round of talks is on Saturday. The US Army and US Air Force are staying in the region until an agreement is in place.
The sense is that while the US is posturing hard, it has probably decided to get out of the region, leaving local issues to regional players like Israel, Iran, and Lebanon.

Get your Portfolio Momentum Report today and ensure your investments are positioned for success!

Forwarded this email? Subscribe Now
Top Trending Strategies
Mi EverGreenPower of Gold with Equity | Allocate 20 strongest CNX200 stocks with Gold ETF | Monthly Rebalanced Mi Evergreen is a dynamic strategy which aims to outperform the underlying benchmark CNX200. This index comprises 200 large and mid-cap names which are the top-quality stocks in the markets. This product is suitable for use in all stages of the market cycles as it is designed to invest in the strongest stocks in the pack at any point. Additionally, there is a permanent hedge of Gold available here.
| Mi AllCap GOLDA core strategy to allocate 25% each to Large Cap , Mid Caps, Small Caps & Gold Mi AllCap GOLD is a robust, rule-based core rotational strategy from the House of WeekendInvesting, curated to cover stocks in the CNX500 universe, designed to offer a balanced asset allocation and diversified wealth creation approach for compounding returns over long periods of time.
|
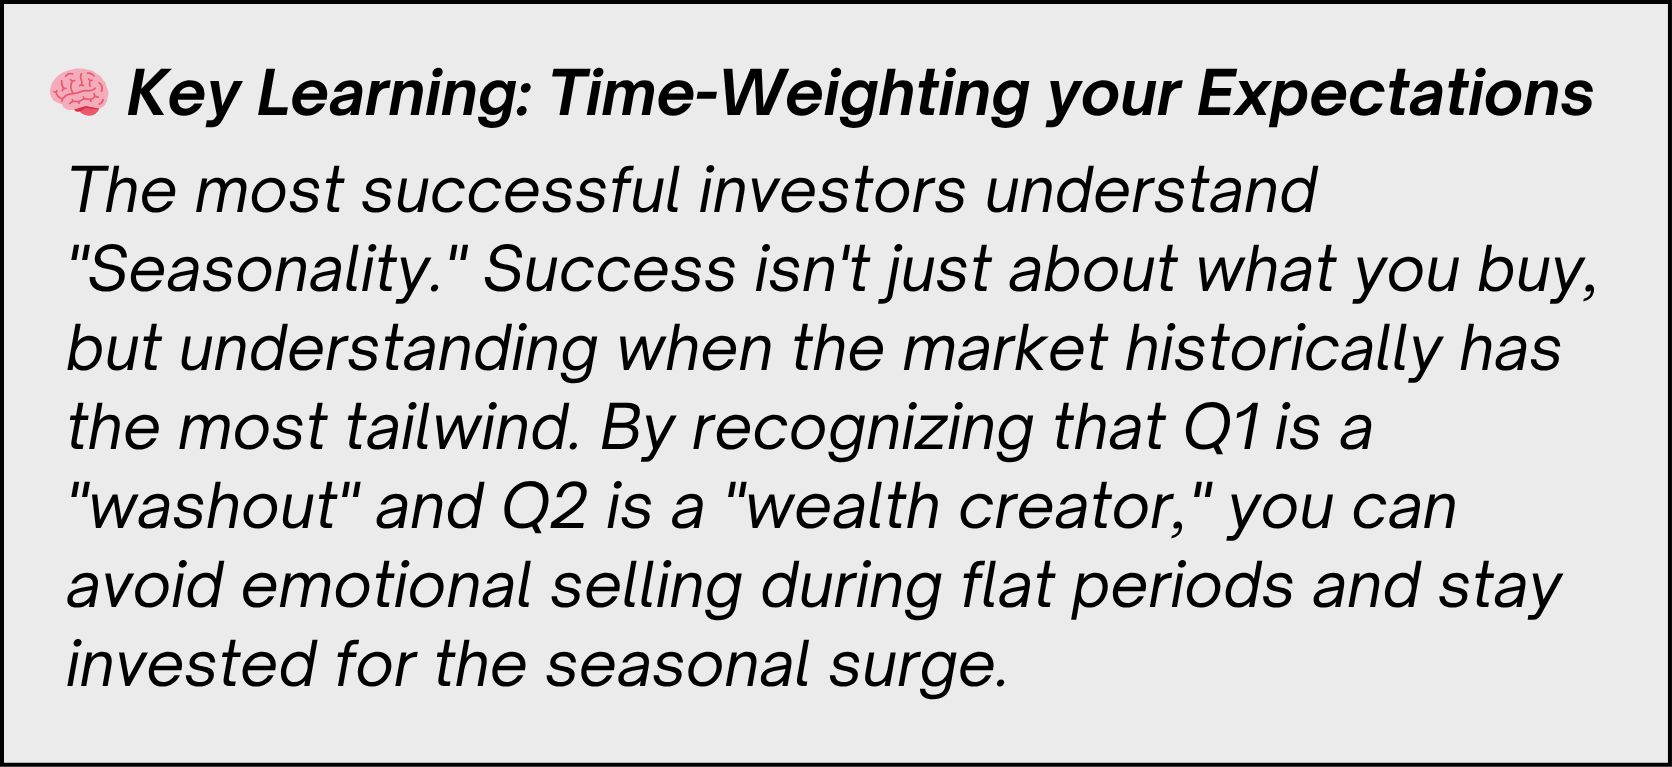
The "Q2 Edge": Why the Next Three Months Could Be Your Portfolio’s Best Friend
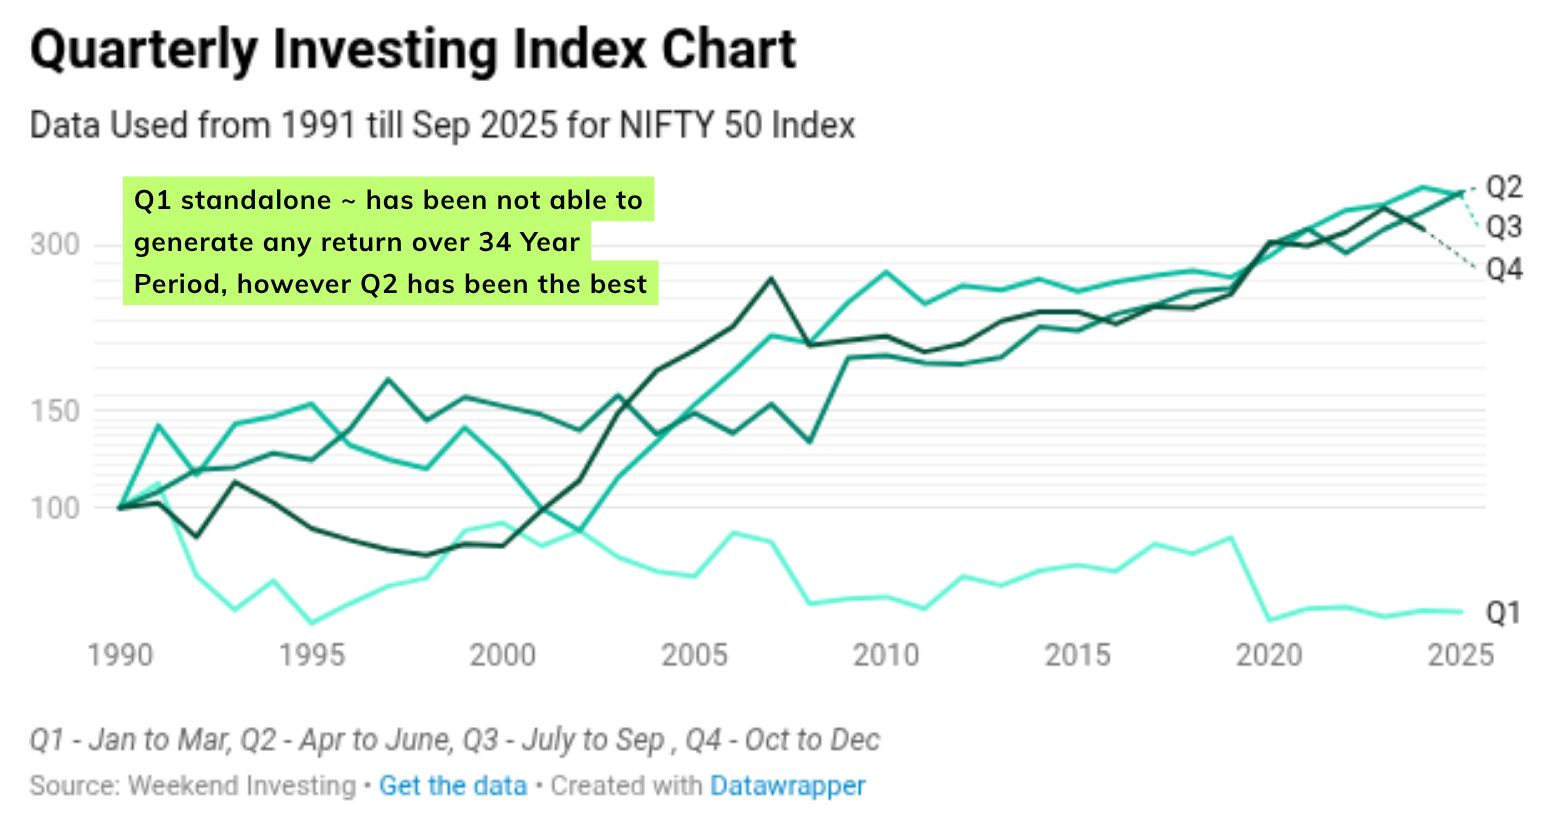
Today, we are breaking down over 35 years of historical index data to uncover a fascinating pattern in seasonal investing. If history is any indication, we are currently entering the "Golden Quarter" for market returns.
The Quarterly Breakdown: Not All Months Are Equal
When we look at market performance over the last three and a half decades, a clear trend emerges. The year is a tale of four quarters, but the returns are anything but evenly distributed. While some periods act as a "reset" button, others act as the engine for annual growth.
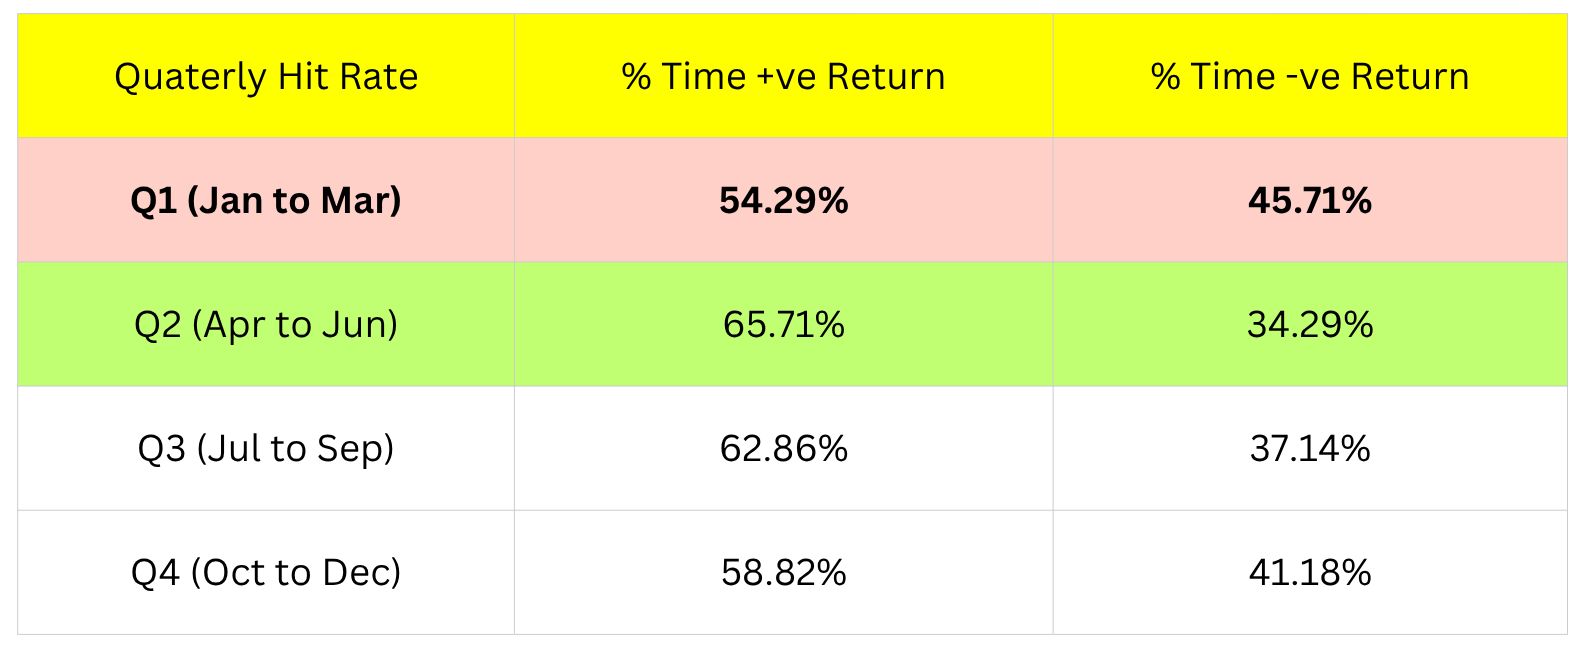
Quarter 1 (Jan–Mar): Historically the weakest. With positive returns only 54% of the time and negative returns at 47%, the gains and losses almost entirely cancel each other out. Over a 30-year horizon, Q1 essentially delivers zero net return.
Quarter 2 (Apr–Jun): The undisputed champion. This quarter boasts positive returns 65% of the time, significantly outperforming the rest of the year.
Quarter 3 & 4: These quarters remain steady (62% and 58% positive hit rates, respectively) but fail to match the momentum found in the spring and early summer months.
Why Q2 Takes the Crown
The "April to June" surge isn't just a coincidence; it’s backed by structural market behavior. As we kick off the new financial year, several catalysts come into play:
Fresh Capital Inflow: Institutional and individual investors often deploy new sets of capital at the start of the financial year.
Post-Closing Momentum: After the books are closed in March, the market sheds the "year-end" pressure and looks forward with a clean slate.
Positive Sentiment: Historically, this period provides a renewed momentum that carries the index higher, and the data suggests this year will be no different.
Meme Of The Day

History shows that Q2 is the most profitable quarter for the markets. How does this data affect your investment strategy for the next three months? |
|

Share this daily insightful newsletter with your market savvy friends and family or sign them up for the newsletter !
For detailed blogs, reports and strategies, check WeekendInvesting.com
Reply