- WeekendInvesting
- Posts
- Are We Heading Towards Another Bubble Burst?
Are We Heading Towards Another Bubble Burst?
Do you follow the story or the stock price?
WeekendInvesting Analytics
July 29, 2025

29 July 2025 · Tuesday
Forwarded this email? Subscribe here for more
Good evening, WeekendInvestor
Inflate. Peak. Collapse: The Bubble Cycle Explained
Ever wonder why market rallies often end in crashes? It’s a cycle—moving from under-ownership to over-ownership, just as valuations swing from undervalued to overvalued and back again.

Predicting the exact peak of a bubble is extremely difficult. More often than not, it’s an external trigger that bursts the narrative—exposing how fragile even the most promising stories can be.
Spotting Red Flags: Sector Concentration
One major warning sign of a bubble is when a single sector starts dominating a diversified index. Consider the S&P 500: semiconductor stocks now make up around 11%. Historically, this figure hovered between 1–1.5% in the 1970s–80s and 3–4% in more recent decades.
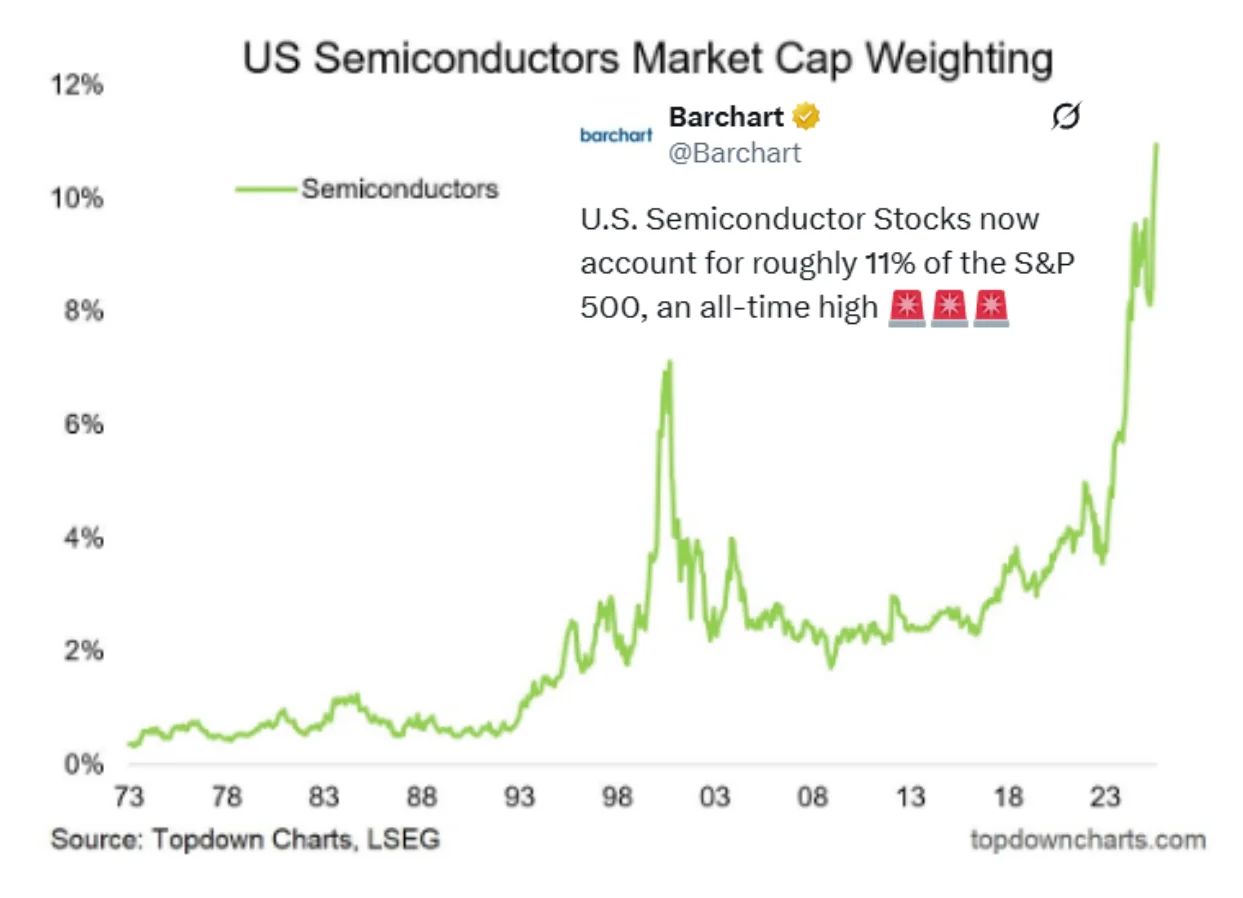
This sudden surge is concerning. It echoes the concentration seen during the Dot-com bubble, which led to a prolonged correction—taking the NASDAQ nearly 20 years to recover.
The NVIDIA Effect: Insiders vs. Institutions
The semiconductor rally led by companies like NVIDIA, now valued at over $4 trillion—has reached extraordinary levels. On the surface, everything looks solid. But behind the scenes, company insiders are selling shares at an aggressive pace, pointing to potential overextension.
Meanwhile, institutional investors and the public remain highly optimistic. This kind of divergence—insiders selling while sentiment stays euphoric—has historically signaled that a correction may be near.
Protecting Your Portfolio: Stay Alert
A downturn, even if it begins in one sector, can pull the broader market down with it. While the boom continues, it’s important to stay prepared for possible global selloffs. Booms rarely end quietly. Use this time to reassess your risk, review portfolio exposure, and stay flexible:


Today’s Daily Byte
Markets bounced back after a weak start, with strong post-noon buying across the board. Mid and small caps joined the recovery, led by gains in real estate and pharma. IT remained under pressure, but overall sentiment improved sharply by the close.
Reading Time : 7 Minutes
Top Trending Strategies
Mi 20This 20 stock portfolio is made up of the strongest mid and Smallcap stocks from the Mid-Small Cap 400 Index. It is rebalanced weekly. | Mi EverGreenThis 20 stock portfolio selects large and mid cap stocks from the CNX200 index. It also has a fixed 25% allocation to Gold ETF as a hedge. It is rebalanced monthly. |
Why Stock Prices Often Ignore the Headlines
Stock market reactions aren’t always as straightforward as they seem. A sharp fall in profits doesn’t necessarily mean a drop in share price. While headlines scream decline, the market might already be looking past the data. That’s because price often reflects expectations, not just current results. In many cases, the narrative simply lags behind.
Reading Time : 2 Minutes
Portfolio Momentum Report
Your deep dive into two critical metrics to assess your portfolio’s potential:
1️⃣ Momentum Score: See what percentage of your portfolio is in high vs. low momentum stocks, giving you a snapshot of its performance and health
2️⃣ Weightage Skew: Discover if certain stocks are dominating your portfolio, affecting its performance and risk balance.
💡 Why it matters:
Weak momentum stocks can limit your gains, while high momentum stocks improve capital allocation, enhancing your chances of superior performance.
🎥 Watch this video to learn more :
Get your Portfolio Momentum Report today and ensure your investments are positioned for success!
Click here : https://momentumreport.weekendinvesting.com/
Most Trending Topics
 Right way to compare India & US Market Returns |  Silver’s Wild Moves: A Metal Worth Noticing |
Follow for Daily Market Updates and Insights

Share this daily insightful newsletter with your market savvy friends and family or sign them up for the newsletter !
For detailed blogs, reports and strategies, check WeekendInvesting.com
Disclaimers and disclosures : https://tinyurl.com/2763eyaz
Disclaimer : This newsletter is for informational and educational purposes only and does not constitute financial advice or an advertisement
Reply