- WeekendInvesting
- Posts
- Biggest Learning From 75 Years of Japan Stock Market
Biggest Learning From 75 Years of Japan Stock Market
Analysing The Dollar Index Crash
WeekendInvesting Analytics
May 07, 2026

SPECIAL OFFER
Hi Investor,
2 years of ~0% returns on Nifty Junior. Historically, what followed has been extraordinary — every single time.
We built Mi NNF 10 to try and capture that upside and also be prepared for all kinds of market scenarios .
This strategy has been trusted and loved by several thousands of investors all across the globe.
Get 30% off with code NNF30 — first 50 users only.
Request Performance data → https://forms.gle/fry26MDfwrVrfNez7
Market Update - Thursday, 07 May
Japan is currently reaching new record highs in the stock market nearly every day, marking a significant shift in a narrative that has lasted for decades. Looking back over the last 75 years, the Japanese index has climbed from a base of 100 to levels around 59,000 or 60,000 today. While there is a common folklore that Japan is a poor market for investment, this stems from the 35-year period it took to adjust to the phenomenal growth seen in the mid-twentieth century.
Between 1950 and 1990, the Nikkei index rose 400 times, reflecting a 16% compound annual growth rate. During that peak, the market was so hot that legend says the Imperial Palace in Tokyo was valued higher than the entire state of California. This led to a natural consolidation that lasted two generations, but since bottoming out in 2010, the market has grown seven times over. This serves as a reminder…..
The Nifty remained flat today, ending down 0.02%, while the Junior Nifty rose 0.23% to a recent new high.
Mid-caps showed a phenomenal move of 1.1%, reaching an all-time high and highlighting their role as a sweet spot for aggressive growth where future leaders emerge.
Small caps also performed well, rising 1.02%, showing that while large caps are currently sulking, the broader market is doing quite alright.
In other asset classes and sectors, the Nifty Bank moved up a slight 0.12%, and gold saw a minor increase of 0.38%.
It is expected that once a resistance level of 15,500 is taken out, there may be significant moves in dollar gold toward the $4,900 mark, up from the current level below $4,700.
Brent oil is trending downward below $100 after reaching $116, which is a positive sign, though a conclusive deal is still needed for prices to truly come off.

Other Market Triggers
The advance-decline ratio remained in favor of gainers today with 305 advances to 155 declines.
On the sectoral heatmap, FMCG companies like Hindustan Unilever, Nestle, and ITC took a hit, and IT stocks continued to struggle. However, there was strength in auto stocks, steel, and commodities.
Within the Nifty Next 50 space, the results were mixed, though capital goods, defense, and real estate showed positive movement.
A standout performer today was Godrej Industries, which surged 20% after announcing a brand repurposing and a bold ambition to reach 5 lakh crore in revenue by 2031. This move demonstrates how impactful corporate branding and a clear vision can be on stock price, even when nothing has changed on the ground immediately. Technically, the stock broke out of an inverse head and shoulders pattern, resulting in a massive single-day move.
Tejas Network is also performing well under a new CEO, picking up momentum after a dull period following a run-up in late February.
U.S. Market Updates
In the United States, markets are showing incredible strength, particularly in the semiconductor and AI sectors. AMD rose 18% in a single day, while NVIDIA gained nearly 6%, and other tech giants like Intel and ASML also posted strong gains.
While some may debate if this is a bubble, the momentum is undeniable. The NASDAQ rose 2%, the S&P 500 gained 1.5%, and the Dow and Russell indices also ended higher.
With many global markets, including the US and Japan, sitting at all-time highs, there is optimism that the local markets could follow suit soon.
What to watch next ?
The markets are moving upward but without strong confidence or aggressive momentum. Much of this hesitation is due to ongoing discussions regarding a memorandum between the United States and Iran, with a one-week deadline set for acceptance.
While oil prices have dropped about 10% to 12% to sit around $100, the situation remains tentative because of the volatile moods on both sides.
Consequently, the markets have largely decided not to react strongly in either direction until a final deal is reached.

Forwarded this email? Subscribe Now
Top Trending Strategies
Mi EverGreenPower of Gold with Equity | Allocate 20 strongest CNX200 stocks with Gold ETF | Monthly Rebalanced Mi Evergreen is a dynamic strategy which aims to outperform the underlying benchmark CNX200. This index comprises 200 large and mid-cap names which are the top-quality stocks in the markets. This product is suitable for use in all stages of the market cycles as it is designed to invest in the strongest stocks in the pack at any point. Additionally, there is a permanent hedge of Gold available here.
| Mi AllCap GOLDA core strategy to allocate 25% each to Large Cap , Mid Caps, Small Caps & Gold Mi AllCap GOLD is a robust, rule-based core rotational strategy from the House of WeekendInvesting, curated to cover stocks in the CNX500 universe, designed to offer a balanced asset allocation and diversified wealth creation approach for compounding returns over long periods of time.
|
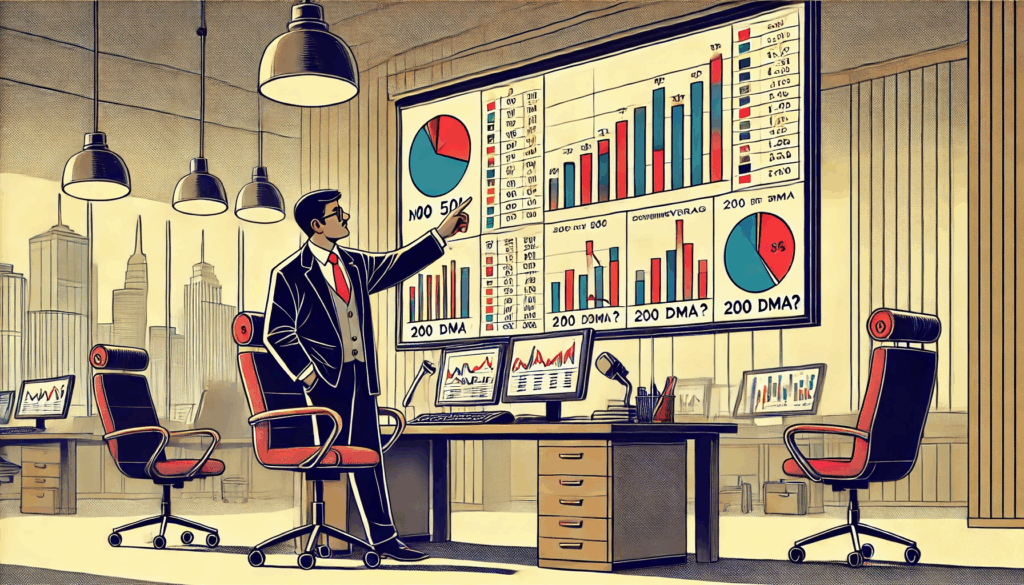
The Dollar Index: Understanding the Global "Power Barometer"
The financial world often revolves around a single number: DXY, commonly known as the Dixie or the US Dollar Index. If you’ve ever wondered how the US Dollar (USD) is truly performing on the global stage, this is the metric to watch. It doesn't just track the dollar; it measures the dollar's relative strength against a "basket" of six major world currencies, with the Euro being the most dominant player in that group.
Think of it as a tug-of-war. When these six currencies appreciate (gain value) against the USD, the Dollar Index falls. Conversely, when the USD overpowers them, the index climbs.
The Safe Haven Shift: Gold vs. The Greenback
Since the onset of the Ukraine conflict in 2022, we have witnessed a fascinating structural shift. Traditionally, the US Dollar has been the ultimate "Safe Haven"—the place investors run to when the world gets messy. However, that dominance is facing a quiet challenge.

Source : Ritesh Jain on X
Global reserves are gradually shifting toward Gold. While the USD remains the primary world reserve currency, its iron grip is loosening. This transition signals that central banks and large-scale investors are diversifying their safety nets, looking beyond paper currency to hard assets.
Consolidation and the "Breakdown" Watch
Looking at the charts over the past year, the Dollar Index has been in a phase of consolidation. It isn't crashing, but it isn't soaring either—it’s moving sideways. We are currently at a critical crossroads:
The Bearish Scenario (Good for India): If the index breaks down and starts falling, it’s a green light for Emerging Markets like India and for Precious Metals (Gold and Silver). It means capital is leaving the "safety" of the dollar to seek higher returns in other asset classes.
The Bullish Scenario (Global Stress): If we see a breakout to the upside, it could spell trouble. A surging dollar usually means funds are being sucked out of global markets and parked back in US assets, creating liquidity pressure for the rest of the world.
Why Traders Must Watch "Dixie"
For any serious trader or investor, ignoring the DXY is like flying a plane without a fuel gauge. Its inverse correlation with Emerging Markets and Commodities is one of the most reliable signals in finance. When the Dollar Index weakens, your portfolio in metals or Indian equities generally finds more room to breathe and grow.

Meme Of The Day


Share this daily insightful newsletter with your market savvy friends and family or sign them up for the newsletter !
For detailed blogs, reports and strategies, check WeekendInvesting.com
Reply