- WeekendInvesting
- Posts
- Does India Really Need Longer Trading Hours?
Does India Really Need Longer Trading Hours?
Nasdaq Goes 23/5

WeekendInvesting Analytics
August 18, 2026

Market Update - Tuesday, 18 Aug
A somewhat daunting chart formation is developing near the trendline drawn from the April bottom, which the market is rapidly approaching and could test within a couple of days. A breakdown below this support line could trigger significant downside pressure. For now, the market reflects roughly 12 to 13 sessions of flat movements, with the Nifty dropping half a percent.


Other Market Triggers
The Nifty heat map was overwhelmingly red, with only Mahindra, Axis Bank, and Grasim showing minor green gains.
Indian IT stocks faced continuous selling pressure, including major names like TCS, Infosys, and Wipro, as the AI trade in the US market gained momentum, fueling a contra trade against IT services.
Banking heavyweights like Kotak, SBI, and HDFC Bank were also heavily hit.
On the Nifty Next 50 heat map, gains were visible in select capital goods, Adani, pharma, and defense stocks.
Conversely, previous gainers in steel, commodities, capital goods, PSU banks, and finance stocks faced sharp declines.


U.S. Market Updates
In the US markets, the previous session closed in the red, with the S&P 500 down, the Dow Jones falling 0.5 percent, the Nasdaq flattish at minus 0.17 percent, and the Russell 0.3 percent lower.


Have questions about our U.S. Strategy? Email us at [email protected]
What to watch next ?
A notable tweet of the day highlighted Nike, which has fallen to its lowest stock price in 12 years. Investors who purchased Nike stock four to five years ago face drawdowns of nearly 80 percent, proving that iconic global consumer brands do not guarantee strong stock performance.

Inexperienced investors often assume well-known brands automatically make superior investments, yet Nike demonstrates that a great commercial brand can fail to deliver equity returns over a twelve-year horizon, leaving investors averaging down into multi-year lows. Brand popularity should guide product consumption rather than investment decisions.

Forwarded this email? Subscribe Now
Strategy Of The Day

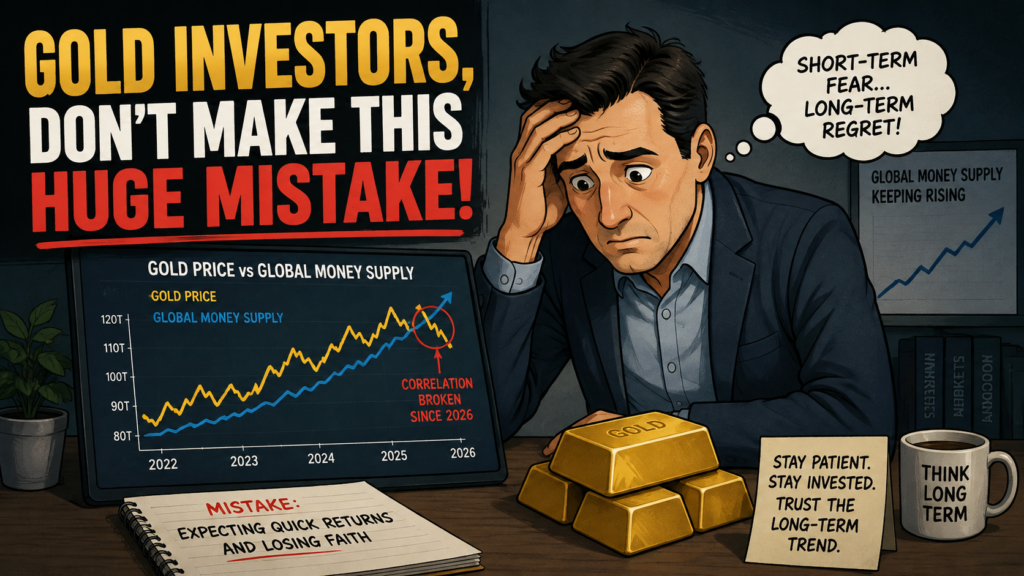
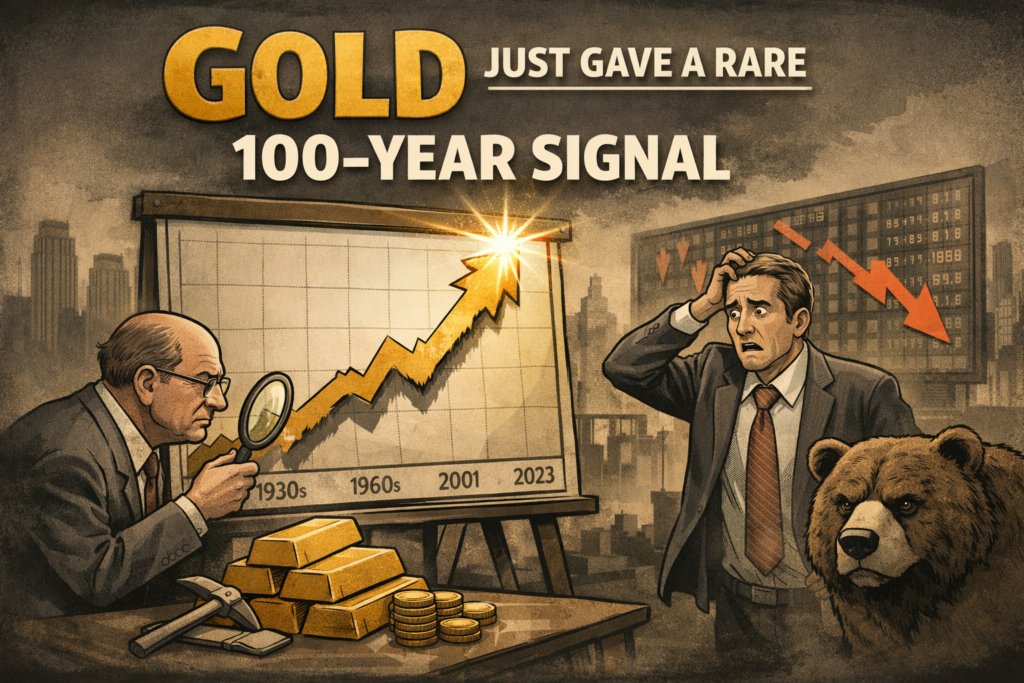
Gold Could Explode: Is $20,000 Really Possible?
Gold price targets are a big question for investors today. One way to look at gold's future is by comparing gold with the S&P 500. A long-term gold-to-S&P 500 ratio chart covering around 100 years shows that gold has reached much higher levels during some of the toughest periods for the economy and markets.

Meme Of The Day


Share this daily insightful newsletter with your market savvy friends and family or sign them up for the newsletter !
For detailed blogs, reports and strategies, check WeekendInvesting.com
Reply