- WeekendInvesting
- Posts
- Gold headed to $5000 Soon ?
Gold headed to $5000 Soon ?
Why Gold is Shadowing Global Debt
WeekendInvesting Analytics
December 23, 2025

Market Update - Tuesday, 23 Dec
It was a relatively quiet day, which is not surprising following the very nice run-up during the previous session. The current flatness is not a cause for concern as the market is simply consolidating at its current level.
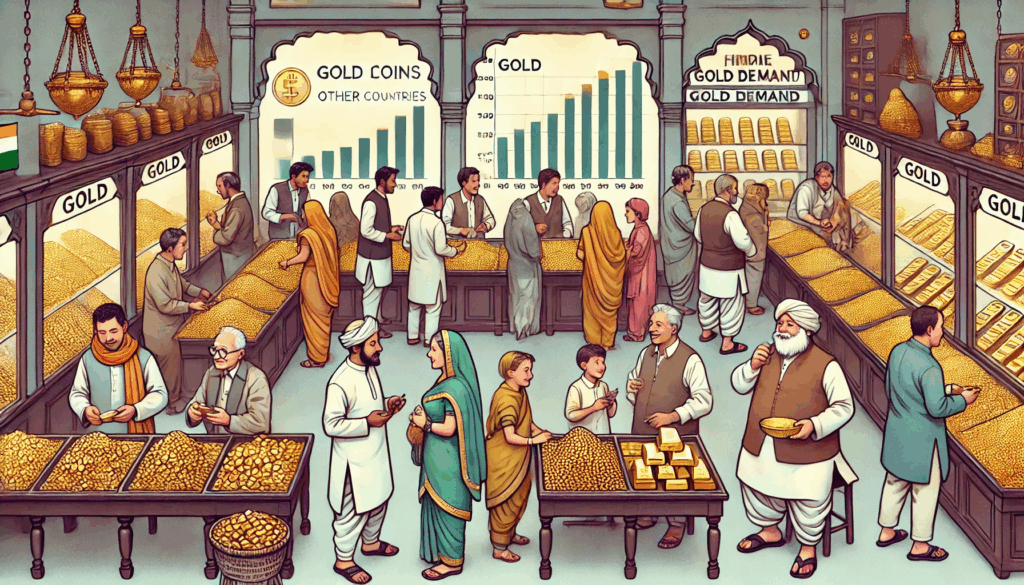
One of the most significant topics of the day is the performance of gold and silver, which are hitting new record highs daily. Gold has reached almost $4,498 on the USD chart, while silver has hit $70. This move in silver is particularly surprising given that it was trading near $30 not very long ago. While mainstream media, such as the Financial Times, attributes this rise to geopolitical tensions, this view may be overlooking the deeper reality.
Looking at the specific market charts, the day was extremely flat with a minor gain of 0.02%.
Nifty Junior gained 0.37%, Mid Caps rose slightly by 0.11%, and Small Caps climbed 0.42%.
Nifty Bank remained nearly flat at -0.01%.
Gold rose 0.9%, bringing the rate to 13,688 INR per gram, a significant jump from 11,600 just two months ago. Silver followed a similar path, rising to 211000 within a few months.

Other Market Triggers
Notable performers included ITC, Tata Motors, UltraTech Cement, Coal India, HDFC Bank, Kotak Bank, and Shriram Finance.
Conversely, Infosys, TCS, Bharti Airtel, Adani Ports, and Bajaj Auto lost some ground.
In the Nifty Next 50 space, IRFC, PFC, Swiggy, and Cholamandalam Finance did well, along with Hindustan Zinc, Ambuja Cement, and Jindal Power.
Losses were seen in Motherson, CG Power, and Bank of Baroda, though no major downside moves were recorded.
Nazara Tech was a mover of the day, gaining 6% after previously losing ground.
U.S. Market Update
US markets are also performing well, with major indices up about 0.5% and the Russell 2000 gaining 1% or more.
Stocks like Merck, Oracle, Citigroup, Blackrock, and Charles Schwab saw gains, with Merck rising from $75 to nearly $100 in recent months. Some of these may be part of the internal US stock strategies, though these mentions are not formal recommendations.
What to watch next ?
Unless significant bad news emerges, the markets are likely to move higher. A healthy sector rotation is currently underway.
There is a general reduction of confidence in fiat currencies across the globe. This shift is fueled by the realization that money kept in cash is depleting rapidly. Headline inflation numbers often fail to show the actual inflation people are experiencing.
Get your Portfolio Momentum Report today and ensure your investments are positioned for success!

Forwarded this email? Subscribe Now
Important Announcement
We are now live on our official WhatsApp Channel. We share all our strategy updates, rebalances, and important announcements here. Please watch this video to know more & join in at the earliest possible.
Top Trending Strategies
Mi EverGreenPower of Gold with Equity | Allocate 20 strongest CNX200 stocks with Gold ETF | Monthly Rebalanced Mi Evergreen is a dynamic strategy which aims to outperform the underlying benchmark CNX200. This index comprises 200 large and mid-cap names which are the top-quality stocks in the markets. This product is suitable for use in all stages of the market cycles as it is designed to invest in the strongest stocks in the pack at any point. Additionally, there is a permanent hedge of Gold available here.
| Mi AllCap GOLDA core strategy to allocate 25% each to Large Cap , Mid Caps, Small Caps & Gold Mi AllCap GOLD is a robust, rule-based core rotational strategy from the House of WeekendInvesting, curated to cover stocks in the CNX500 universe, designed to offer a balanced asset allocation and diversified wealth creation approach for compounding returns over long periods of time.
|
The Golden Barometer: Why Gold is Shadowing Global Debt
Recent data from Bloomberg reveals a startling correlation that every investor should pay attention to. For the past 20 years, two lines on the global financial chart have been moving in near-perfect lockstep: the price of Gold and the Global Government Interest Expense.
As governments struggle with mounting debt and the end of the "cheap money" era, gold is emerging not just as a commodity, but as a direct reflection of fiscal instability.
The Bloomberg Chart: A 20-Year Mirror
When we plot the price movement of Gold (the Blue Line) against the Interest Expenses paid by governments globally (the Red Line), the symmetry is undeniable.

Source : Bloomberg
The Trend: As the cost of servicing global debt rises, Gold prices follow.
The Scale: Currently, global interest expenses are hovering around the $5 trillion mark annually.
The Connection: Gold acts as a shadow to the world's debt obligations.
The Compounding Debt Trap
We are currently witnessing a "double whammy" effect on government finances. In the past, Western nations kept interest rates near zero to manage their massive debts. However, that era is over.
Rising Debt Volumes: Total global debt continues to hit record highs; it is practically impossible to reduce at this stage.
Higher Interest Rates: Central banks can no longer keep rates at zero without triggering runaway inflation.
The Result: Higher debt multiplied by higher interest rates creates a compounding interest expense that is becoming unpayable.
Gold as the Ultimate Safety Barometer
Gold has effectively become the world’s "safety barometer." It measures the level of stress in the global fiat currency system.
Why it moves: Investors turn to gold when they realize that the interest burden on government debt is reaching a point of no return.
The "Unpayable" Factor: Gold tracks the realization that governments may never be able to truly "pay back" these trillions, only refinance them at higher costs.
The Outlook: Long-Term Bullish, Short-Term Volatile
While the long-term trajectory for Gold—and even Silver—remains aggressively upward, it is important to stay prepared for short-term "noise."
Short-term risks: A country might suddenly announce the sale of 5–10 tons of gold, causing a temporary price dip.
Long-term reality: Given the current global position, there is no visible scenario where debt decreases. Therefore, there is no visible scenario where the fundamental demand for gold weakens.

Meme Of The Day

Which scenario do you believe is most likely over the next 5 years? |

Share this daily insightful newsletter with your market savvy friends and family or sign them up for the newsletter !
For detailed blogs, reports and strategies, check WeekendInvesting.com
Reply