- WeekendInvesting
- Posts
- How One Company Just Became Bigger Than an Entire Nation's Market!
How One Company Just Became Bigger Than an Entire Nation's Market!
Massive Commodity Boom Ahead?
WeekendInvesting Analytics
May 15, 2026

Market Update - Friday, 15 May
A recent chart from Bar Chart presents a very telling comparison regarding the scale of global market capitalizations. The orange line represents Nvidia Corp…(watch full video)
The Nifty attempted to stay in the green but failed to sustain those levels, closing down 0.19%. While the headline index drop was modest, the internal market health was significantly worse.
The Nifty Next 50, Mid Cap, and Small Cap indices all fell, with some dropping nearly a full percent, while Banks declined by 0.77%.
The market appears spooked by several factors, including recent SBI results, government announcements regarding the need for austerity, and the rupee crossing the 96 mark against the US dollar.
Gold prices are also retreating, largely due to Indian measures designed to rein in imports. Because India is a major buyer in the global market, consuming about 800 tons of the 3,000-ton annual global supply, any domestic restriction causes global demand to collapse. The Indian government has increased import duties from 6% to 15% and restricted authorized banks from importing more than 100 kgs at a time.
This sharp move in gold is being mirrored by silver, which crashed by 6.88%.
Meanwhile, the USD INR reached 96.12 before closing near 95.96, suggesting the RBI may be allowing the currency to move naturally rather than spending reserves to defend specific levels.
Oil prices have started to climb again, nearing $110 per barrel and currently sitting at $109.3. It appears oil markets were waiting for an announcement from the U.S.-China summit, but the lack of a conclusive outcome has pushed prices higher.

Other Market Triggers
In the equity market, the heat map showed a mixed bag. There was some recovery in IT stocks like Infosys and TCS following previous losses, but significant damage was seen in banking, steam, and infra stocks.
Notable losers included Hindalco, HAL, Tata Steel, and Reliance.
Specifically, commodity-led and defense stocks were beaten down, with Siemens, DLF, and Rural Finance also seeing sharp declines.
There is a growing realization that interest rates may stay higher for longer due to rising wholesale inflation.
The new Fed chief is facing 5% yields in the U.S., creating a difficult situation where cutting rates could trigger high inflation.
Locally, moving stocks included Solara Active Pharma, which rallied on revenue growth and operational performance, and Nazara Tech, which jumped nearly 13% amid rumors of a stake increase by Nikhil Kamath.
U.S. Market Updates
In the U.S., the previous session saw an amazing run for tech giants like Cisco, Broadcom, and Nvidia.
While the S&P 500 and Nasdaq gained ground last night in anticipation of the U.S.-China meeting, a reality check may be looming.
What to watch next ?
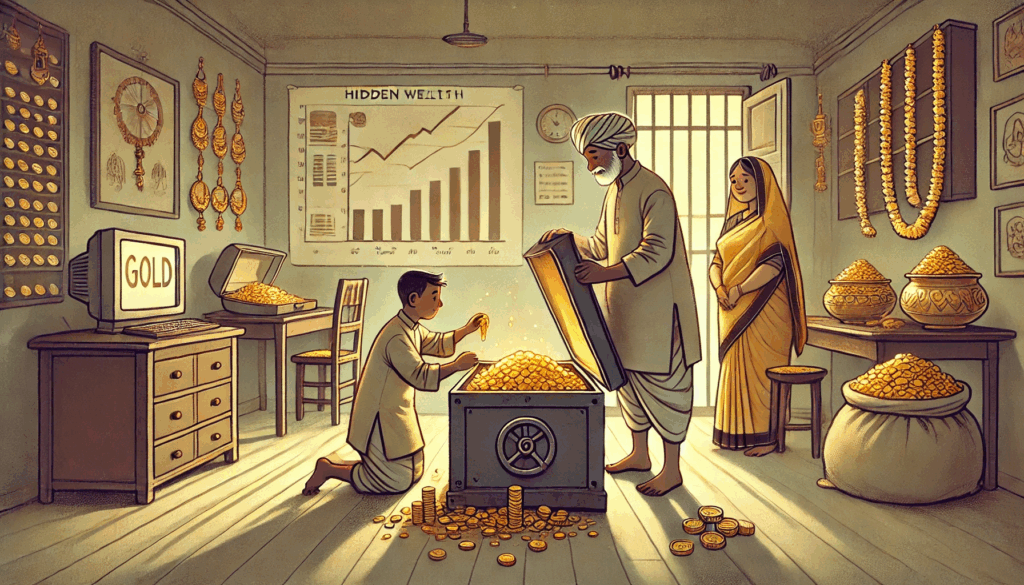
Global gold markets are currently reacting to a significant shift in Indian demand, a development that carries heavy weight given India's role as a cornerstone of the market.
To provide some perspective, India typically demands approximately 800 tons of gold annually, which accounts for more than 25% of the total global supply of roughly 3,000 tons.
Because India is such a dominant player, any domestic policy that restricts its purchasing—whether through tax hikes or quantity caps—causes the international market to shiver. (see the image below)


Forwarded this email? Subscribe Now
Strategy Of The Day

Is the Tide Turning? Commodities vs. Equities
The financial landscape is buzzing with data from In Gold We Trust (IGWT), pointing toward a potential generational shift in asset performance. For decades, the S&P 500 has been the undisputed king, but a specific ratio chart suggests we might be standing at a historic crossroads.
The Ratio That Reveals Everything

Source : IGWT
The chart in question tracks the Total Commodities Return Index divided by the S&P 500. This ratio serves as a "relative strength" indicator. When the line goes up, commodities are outperforming stocks; when it goes down, equities are the place to be.
Historically, we have seen three major commodity "super-cycles" over the last 55 years:
The 1970s: Fueled by oil shocks and high inflation.
The Late 80s to Early 90s: A period of significant industrial demand.
2001–2008: The post-Dot-com bubble era and the rise of emerging markets.
Are We at a Generational Bottom?
Currently, the ratio is hovering near record lows, mirroring the levels seen just before the massive commodity rallies of the past. While a brief rally recently "fizzled out," we are seeing fresh bottoming signs.
Geopolitical tensions—specifically the recent oil shocks linked to the Iran conflicts in March—have pushed the commodity complex sharply higher. While equity markets remain somewhat stagnant (neither crashing nor soaring), commodities are showing aggressive signs of life.
The Inflation Catalyst
The theory is simple: if oil prices continue to climb due to geopolitical instability, inflation could become difficult to contain. In such an environment, equities often struggle to provide real returns, whereas metals and energy tend to thrive.
We aren't just talking about a minor correction; if this trajectory holds, we could see a decisive shift where commodities lead the market for years to come. Some individual commodity stocks are already flashing "buy" signals, suggesting the smart money might already be moving.

Meme Of The Day


Share this daily insightful newsletter with your market savvy friends and family or sign them up for the newsletter !
For detailed blogs, reports and strategies, check WeekendInvesting.com
Reply