- WeekendInvesting
- Posts
- Is it Finally Time for Emerging Markets?
Is it Finally Time for Emerging Markets?
A Shift in Power Ahead?
WeekendInvesting Analytics
December 19, 2025

Market Update - Friday, 19 Dec
The headline news comes from Japan, where the central bank has increased interest rates to 0.75 percent. This is the highest level since September 1995 and represents a massive paradigm shift. Japan has operated near zero interest rate levels for decades to fight deflation, but rising costs for fuel and essentials, along with a weakening yen, have forced a rethink of this easy monetary policy.
Despite the news from Japan, global markets are seeing a positive trend as 2025 concludes. This optimism is primarily driven by softer inflation data from the United States, which reported a rate of 2.6 percent compared to the 3 percent that was expected.
This positive outlook is reflected in the Indian markets as well, with the Nifty up about half a percent. The context of this gain is important because the index has moved above the highs of the previous two candles and has taken support at a critical level. Broader markets are also showing positive figures, and FIIs have now recorded two consecutive sessions of buying in December.
In the commodities space, Silver is a primary point of interest as it heads for an unprecedented eighth consecutive month of gains. After breaking through resistance near 30 dollars, it has performed exceptionally well, signaling a potential 3x move since the start of 2024.
Diving deeper into the indices, the Nifty closed at 0.58 percent higher, managing to stay above the 25,700 to 25,725 support mark.
Nifty Junior rose 0.81 percent and appears to be attempting a trend reversal near the 68,378 level.
The Mid Cap index trumped its last three candles with a 1.16 percent gain, though it faces resistance at 22,146.
Small caps also provided a much-needed breather with a 1.3 percent rise today. This broad participation is vital for a healthy market, especially since lower market caps have lacked traction recently.
Bank Nifty gained 0.27 percent, continuing its steady performance within the financial sector.
While Silver saw a minor daily dip of 0.14 percent and Gold lost 1.15 percent today, the long-term outlook remains optimistic given that Gold recently hit a new all-time high.

Other Market Triggers
Heat maps were predominantly green, with Reliance leading the way with a 1.34 percent gain.
Most banks performed well, with the exception of Kotak Bank, while the IT sector remained somewhat dull despite a positive showing from Infosys.
Auto stocks like Maruti and the Adani Group counters also showed reasonable gains.
One of the biggest movers was Ola, which rallied nearly 10 percent after promoter Bhavish Agarwal cleared all promoter pledges.
U.S. Market Update
In the US, the NASDAQ and S&P 500 showed strong gains driven by the positive inflation data, with stocks like Starbucks, Tesla, and Palantir leading the charge.
Starbucks notably gained nearly 5 percent, breaking past its 87 dollar resistance level. Some of these stocks may be part of Weekend Investing strategies, but these mentions are strictly for information and are not recommendations.
What to watch next ?
If this positive trend continues, it will mark a hat trick of buying sessions, which, combined with the consistent buying from DIIs, could boost the markets toward new all-time highs.
The currency and commodity markets are also seeing notable activity. The Indian Rupee is gaining strength following a small correction in crude oil prices and corporate dollar inflows.
Get your Portfolio Momentum Report today and ensure your investments are positioned for success!

Forwarded this email? Subscribe Now
Important Announcement
We are now live on our official WhatsApp Channel. We share all our strategy updates, rebalances, and important announcements here. Please watch this video to know more & join in at the earliest possible.
Top Trending Strategies
Mi EverGreenPower of Gold with Equity | Allocate 20 strongest CNX200 stocks with Gold ETF | Monthly Rebalanced Mi Evergreen is a dynamic strategy which aims to outperform the underlying benchmark CNX200. This index comprises 200 large and mid-cap names which are the top-quality stocks in the markets. This product is suitable for use in all stages of the market cycles as it is designed to invest in the strongest stocks in the pack at any point. Additionally, there is a permanent hedge of Gold available here.
| Mi AllCap GOLDA core strategy to allocate 25% each to Large Cap , Mid Caps, Small Caps & Gold Mi AllCap GOLD is a robust, rule-based core rotational strategy from the House of WeekendInvesting, curated to cover stocks in the CNX500 universe, designed to offer a balanced asset allocation and diversified wealth creation approach for compounding returns over long periods of time.
|

The Great Rotation: Is it Finally Time for Emerging Markets?
The investment landscape has been dominated by a single narrative for over a decade: US Exceptionalism. However, historical cycles suggest that no trend lasts forever. Today, we are diving into the data to see if the tide is finally turning in favor of Emerging Markets (EM).
Source :BofA Global Research
The 15-Year Performance Gap
Since the Global Financial Crisis of 2008, we have witnessed a massive divergence in performance. If you look at the charts, the US Market (represented by the Blue Line) has been on a relentless bull run. In contrast, Emerging Markets (the White Line, tracking the EEM ETF) have largely moved sideways since 2011-12.
While the US benefited from a massive tech boom and monetary stimulus, the broader EM basket was weighed down by struggles in major economies like China, Brazil, and Russia.
India: The Lone Warrior in the EM Basket
It is important to note that "Emerging Markets" isn't a monolith. While the overall basket underperformed, India has been a notable outlier. Since 2012, India has delivered reasonably strong performance, decoupling from the weakness seen in other EM peers. However, because the EEM ETF is heavily weighted toward countries that faced structural issues, the overall EM index looks lackluster compared to the S&P 500.
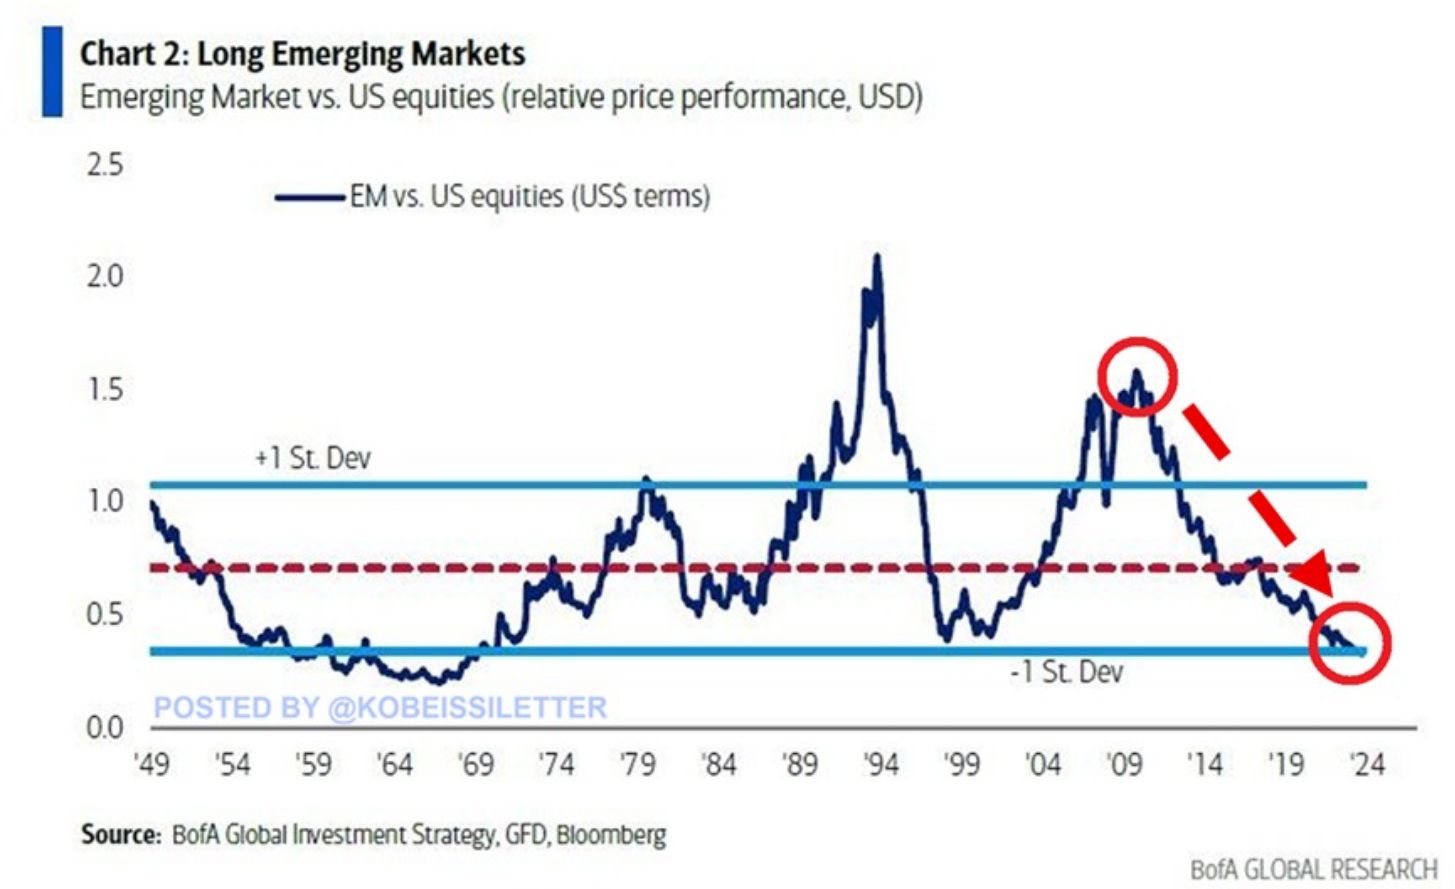
Decoding the EM/US Ratio
To understand where we are headed, we look at the Ratio Chart (EM vs. US Equities). This chart tells a fascinating story of mean reversion over the last 70–80 years:
When the ratio falls: US Equities are outperforming.
When the ratio rises: Emerging Markets are outperforming.
Historically, EM has seen massive outperformance cycles during the 1970s, the late 1980s, and the legendary run from 2003 to 2008. Interestingly, the ratio has now returned to the same historical lows from which it has pivoted in the past.
The Road Ahead: A Shift in Power?
We are currently at a critical juncture. The ratio is sitting at a multi-decade support level. This suggests that the next 5 to 10 years could look very different from the last decade. We might see:
US Markets entering a consolidation or "sideways" phase as valuations cool down.
Emerging Markets beginning a new "re-rating" cycle as capital flows back toward undervalued regions.
The big question remains: Is the "EM Time" finally here, or are we just at the doorstep?
Meme Of The Day
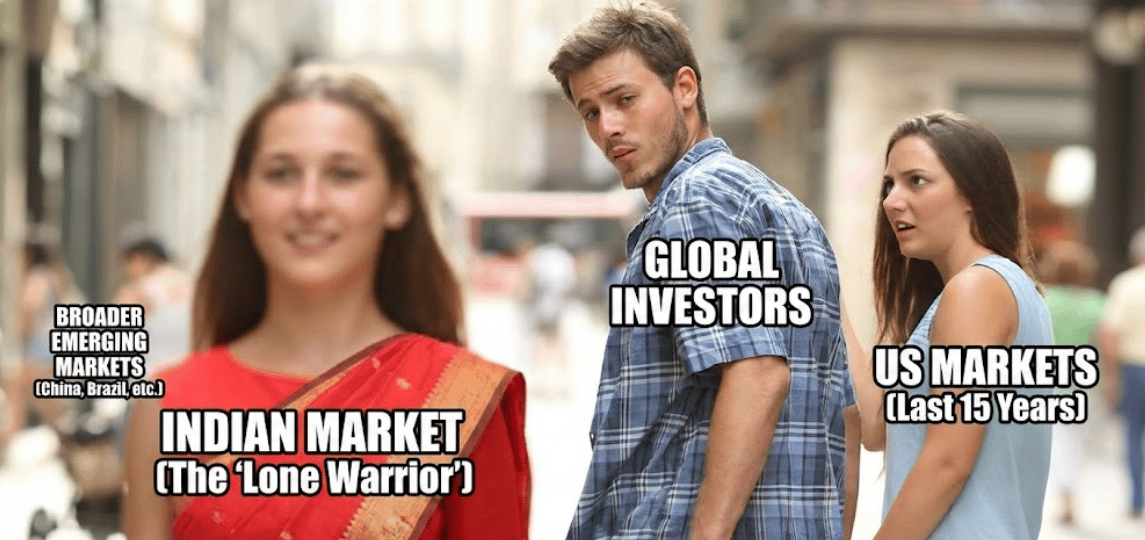
After 15 years of US dominance and the EM/US ratio hitting a multi-decade low, where do you believe the "Alpha" (excess returns) will come from over the next 5–10 years? |

Share this daily insightful newsletter with your market savvy friends and family or sign them up for the newsletter !
For detailed blogs, reports and strategies, check WeekendInvesting.com
Reply