- WeekendInvesting
- Posts
- Is Market Finally Giving Bottom Signals ?
Is Market Finally Giving Bottom Signals ?
Oil Spikes vs. Recessions
WeekendInvesting Analytics
April 06, 2026

Market Update - Monday, 6 Apr
Once again, the market is bouncing off the morning lows, showing a very clear trend over the last two sessions that the market is not willing to stay low. In fact, new buying is coming through on every dip. This represents a significant change in the markets that has been observed over the last two days.
There seems to be significant optimism in the markets now compared to last week. Last week, any negative news caused the markets to go down throughout the day. Now, despite poor news from overseas, the markets are still gapping down but recovering and actually moving into the green during the last two sessions.
Nifty is up 1.1%, and the Nifty Next 50 closed comfortably above its three-day high at 1.45%.
Mid-caps are up 1.44%, near a two-day high, while mid-small caps are up 1.07%, sitting above a four-day range.
Although the short term is turning negative, the Nifty Bank is also up 2.06% and above its three-day range. All of this points toward a good week ahead unless something dramatic happens on the war front.
Gold is up 0.42% at a price of 14883, showing some thawing, while silver remains absolutely flat.
Other Market Triggers
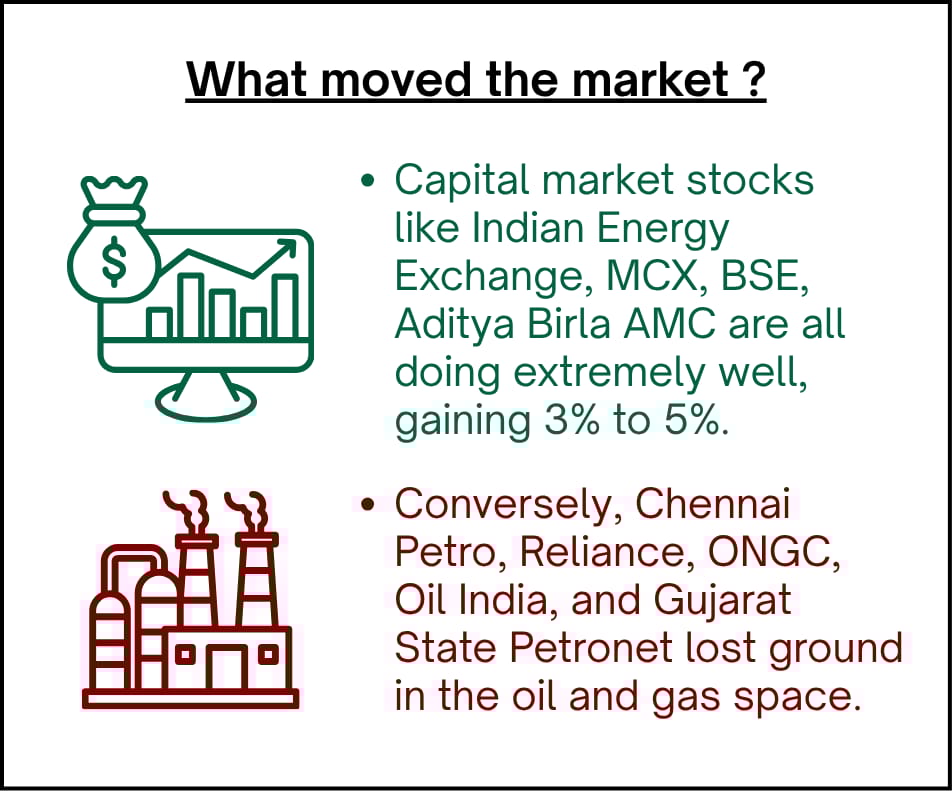
The Nifty heat map is completely green barring energy stocks like Reliance and ONGC, along with some stagnation in Eicher and JSW. Most other stocks in the Nifty are in the green.
The Next Nifty heat map also shows more stocks in the green, including Muthoot, Bank of Baroda, Ambuja Cement, and DMart.
Consumer stocks like DMart and V-Mart have been running very hard in the last two or three sessions, though Divi's Lab, Hyundai, and VBL were a bit soft today.
In the mover of the day segment, V-Mart is extending gains for a third straight session with a 31% rise. As mentioned, these consumer stocks are doing extremely well, reflecting new optimism in the market.
Zydus Wellness is also up 15%, gaining 17% in just two or three sessions.
U.S. Market Updates
In the previous session of the US markets, Intel Corporation went up 4.8% and AMD rose 3.4%. Netflix, Accenture, and IBM also moved up.
While the S&P 500, Dow Jones, and Nasdaq remained very quiet, the Russell 2000, which represents small caps and the larger breadth of the US market, moved up almost 0.7%, which is good news.
The Nasdaq 100 heat map showed gains for Netflix, Costco, Walmart, AMD, and Intel, while losses were seen in Tesla, Meta, Google, and ASML.
What to watch next ?
The market is certainly expecting a bounce or a V-turn from here, and the bears suddenly seem to be giving up at this point.
Understanding this nuance of the market move versus the narrative is very important for acting accordingly going forward.
Gap down openings are being met with buying on dips, which is a very good sign for a potential bottoming out of the markets.

Get your Portfolio Momentum Report today and ensure your investments are positioned for success!

Forwarded this email? Subscribe Now
Top Trending Strategies
Mi EverGreenPower of Gold with Equity | Allocate 20 strongest CNX200 stocks with Gold ETF | Monthly Rebalanced Mi Evergreen is a dynamic strategy which aims to outperform the underlying benchmark CNX200. This index comprises 200 large and mid-cap names which are the top-quality stocks in the markets. This product is suitable for use in all stages of the market cycles as it is designed to invest in the strongest stocks in the pack at any point. Additionally, there is a permanent hedge of Gold available here.
| Mi AllCap GOLDA core strategy to allocate 25% each to Large Cap , Mid Caps, Small Caps & Gold Mi AllCap GOLD is a robust, rule-based core rotational strategy from the House of WeekendInvesting, curated to cover stocks in the CNX500 universe, designed to offer a balanced asset allocation and diversified wealth creation approach for compounding returns over long periods of time.
|
The Oil Spike Signal: Is a Global Recession Around the Corner?
Market cycles often rhyme, even if they don't repeat perfectly. If we look at the historical data from the last 50–55 years, a startling pattern emerges regarding crude oil prices and their relationship with global economic health. Today, we are looking at data that suggests we might be at a critical tipping point.
The Historical Correlation: Oil Spikes vs. Recessions
History shows a high degree of correlation between energy costs and economic downturns. When we analyze the Oil Price Deviation from Trend, a specific threshold acts as a warning siren for the global economy.
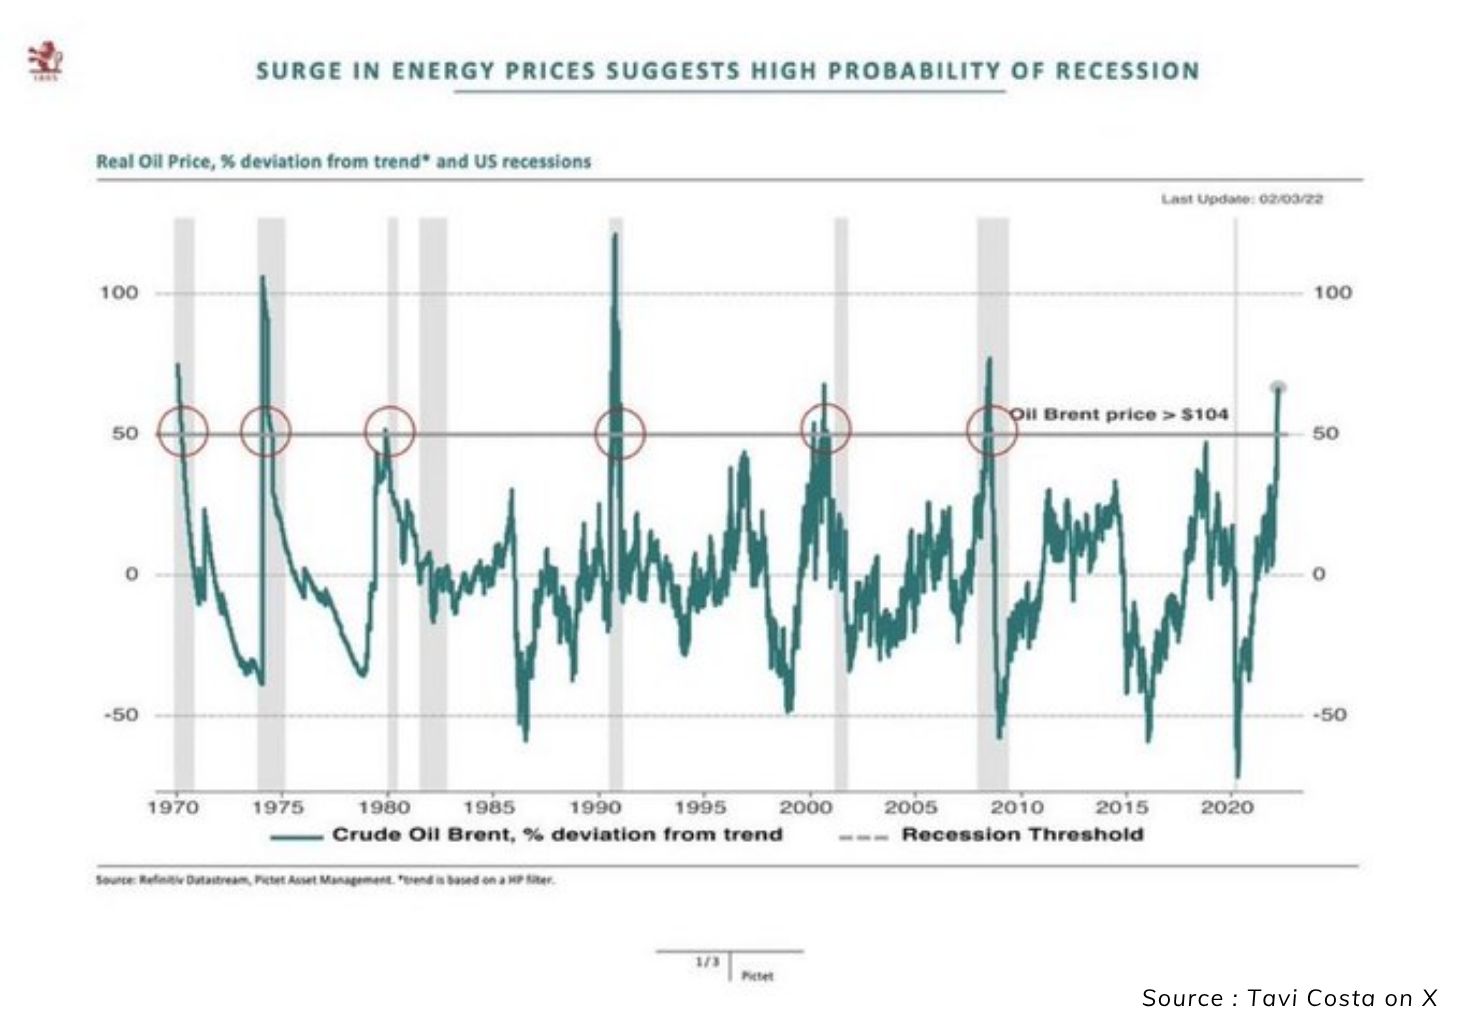
The 50% Rule: Historically, whenever oil prices deviate roughly 50% or more above their normal trend (marked by green line spikes), a recession (the grey bars) typically follows.
The Consistency: This pattern has remained remarkably consistent over the last five decades. Whether the recession lasts for three months or over a year, the "spike" has almost always been the precursor.
Where We Stand Today
We are currently witnessing a situation that mirrors the lead-up to previous crises. Oil prices have already seen a 50-60% deviation from their normal trend.
Given current geopolitical and supply-chain realities, a sudden collapse in oil prices seems unlikely. Instead, the economy is bracing for the "lag effect"—the period where high energy costs seep into manufacturing, transport, and consumer pockets, eventually slowing down growth.
Has the Market Already Factored This In?
The recent volatility and downward trend in global stock markets suggest that investors are already "discounting" this looming reality.
Meme Of The Day

Share this daily insightful newsletter with your market savvy friends and family or sign them up for the newsletter !
For detailed blogs, reports and strategies, check WeekendInvesting.com
Reply