- WeekendInvesting
- Posts
- Is Stagflation Making a Comeback?

Market Update - Friday, 27 Mar
It has been another incredibly difficult day as the markets show no signs of wanting to move upward. Oil prices have started to climb again and an escalation in the war is very much back on track, which is causing significant damage to India.
We closed at 22,800 today, which represents a 2% drop.
The severity of the decline was felt across all indices. The Nifty Junior saw a sharp fall of 2.48%, offering no relief.
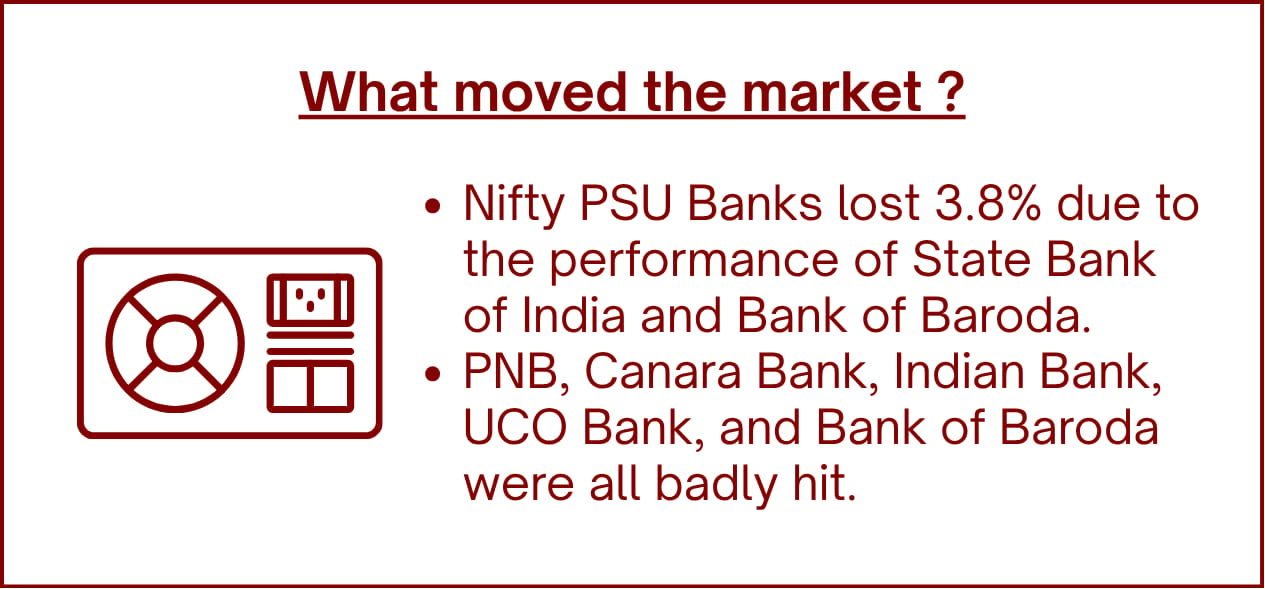
Mid-caps were down 2.1% and the Bank Nifty fell by 2.67%. Public sector banks were particularly hard hit today.
Interestingly, small-caps fell the least at 1.89%, which acts as a small silver lining in an otherwise dark session.
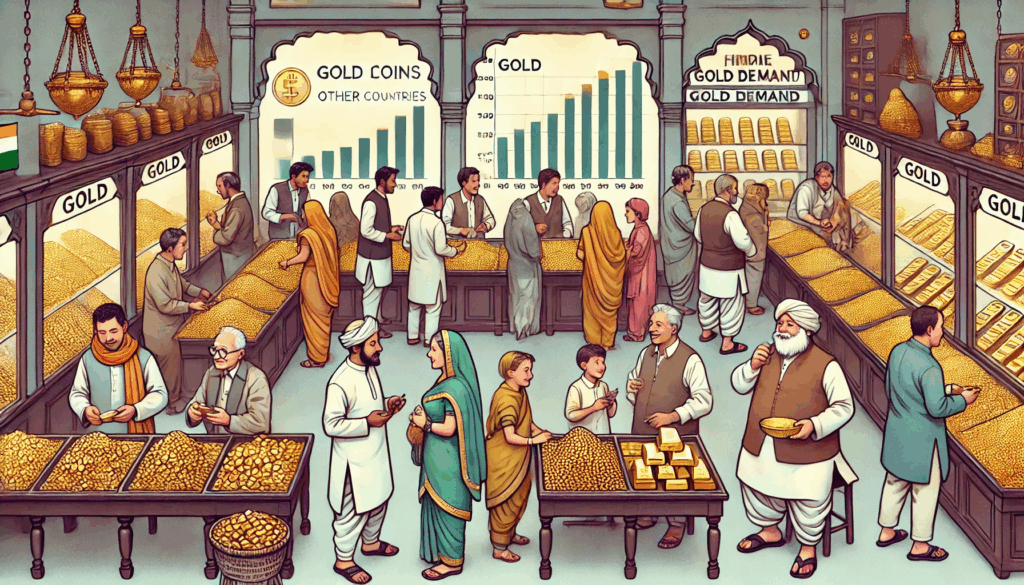
Meanwhile, gold and silver remained relatively flattish, rising 1.6% and 1.5% respectively without making any real directional moves.
Other Market Triggers
The Nifty heat map was dominated by red. HDFC Bank took a major hit of 3.3%, and State Bank of India dropped almost 4%.
Reliance industries fell 4.6% as the government reduced excise but increased taxes on the export of refined products.
Other major players like Unilever fell 2.8%, while Maruti, Mahindra and Mahindra, Bajaj Finance, and Shriram Finance also lost value. The market may be factoring in a potential rate hike as inflation could spike again.
Additionally, the Rupee is collapsing, recently spotted at 94.6 and rapidly moving toward the 95 mark.
However, HEG emerged as a mover of the day, shooting up 13.75%.
Graphite electrode companies are seeing price hikes due to supply chain breakdowns and price increases announced by American peers.
Acme Solar also saw gains as investors rethink solar companies.
U.S. Market Updates
Looking at the previous session in the US markets, there were sharp hits on Meta, Advanced Micro Devices, Intel, Palantir, and Nvidia. Some of these stocks may be part of the Weekend Investing US stock strategy, though these are certainly not recommendations.
US indices also struggled, with the Nasdaq 100 losing 2.3%, the Dow Jones losing 1%, and the S&P 500 down 1.5%.
The Nasdaq heat map provided no place to hide, with Nvidia, Google, Meta, and Amazon all losing big.
What to watch next ?
In terms of where the market is headed, the Nifty is currently wobbling around the 23,000 mark.
While the bounce from two days ago technically remains a potential recovery point in the very short term, it has not been completely overshadowed by today's fall.
However, we have not been able to pull away from the levels between 22,500 and 22,800, remaining close to the recent three-day bottom.

Get your Portfolio Momentum Report today and ensure your investments are positioned for success!

Forwarded this email? Subscribe Now
Dear Investors,
Happy to inform you that we’re moving to a WhatsApp Community to make your experience simpler, more seamless, and easier to access all updates in one place.
Inside the community, you’ll continue to get Rebalance Alerts, Weekly Review & Analysis, Market Nuggets, Daily Bytes, Story-Driven Content, New Launches & Offers, and Special Events & Announcements - all organized for better visibility and ease of use.
Top Trending Strategies
Mi EverGreenPower of Gold with Equity | Allocate 20 strongest CNX200 stocks with Gold ETF | Monthly Rebalanced Mi Evergreen is a dynamic strategy which aims to outperform the underlying benchmark CNX200. This index comprises 200 large and mid-cap names which are the top-quality stocks in the markets. This product is suitable for use in all stages of the market cycles as it is designed to invest in the strongest stocks in the pack at any point. Additionally, there is a permanent hedge of Gold available here.
| Mi AllCap GOLDA core strategy to allocate 25% each to Large Cap , Mid Caps, Small Caps & Gold Mi AllCap GOLD is a robust, rule-based core rotational strategy from the House of WeekendInvesting, curated to cover stocks in the CNX500 universe, designed to offer a balanced asset allocation and diversified wealth creation approach for compounding returns over long periods of time.
|
The Ghost of 1969: Is Stagflation Making a Comeback?
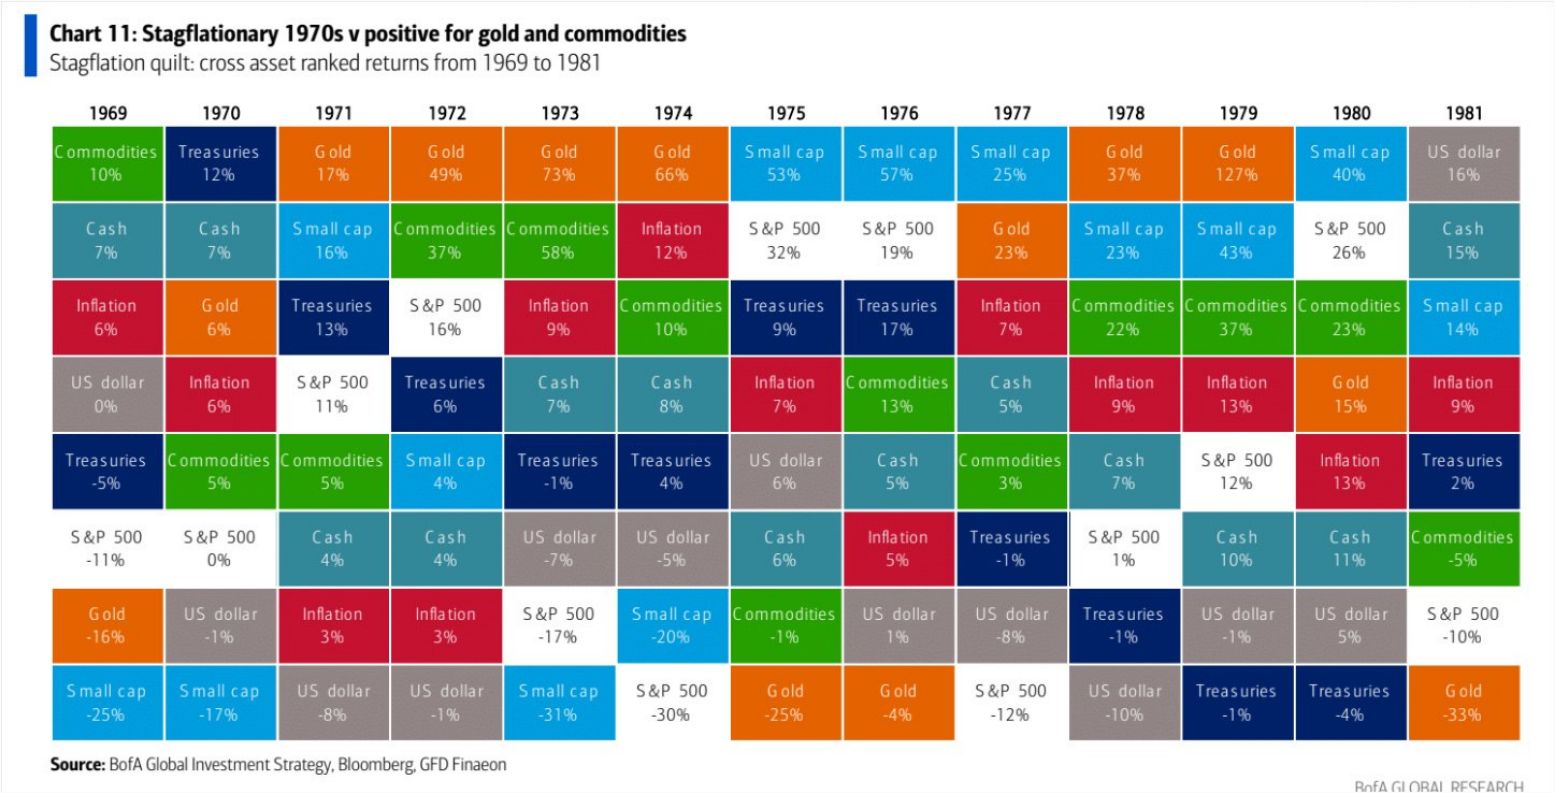
History doesn't always repeat, but it often rhymes. According to data highlighted by Ronnie Stoeferle, we are looking at a potential mirror image of the 1969–1981 era. This 12-year stretch was defined by Stagflation—a punishing economic cocktail where inflation remains stubbornly high while economic growth stalls.
Source : Ronnie Stoeferle
As the world grapples with mountain-high debt, many analysts believe we are entering a "Debt-Based Economy" endgame. To manage massive Debt-to-GDP ratios, central banks (like the US Fed) may allow inflation to run hot to "inflate away" the debt, even if it means sacrificing corporate growth in a high-interest-rate environment.
The Asset Class Showdown: Winners vs. Losers
During the last major stagflationary period, the performance hierarchy of asset classes shifted dramatically. Traditional equities, often represented by the S&P 500, struggled to keep head above water, while tangible assets took the lead.
Commodities & Gold: These were the undisputed champions. Commodities kicked off the cycle in 1969, followed by a massive four-year winning streak for Gold.
Small Caps: Surprisingly, Small Cap stocks found windows of outperformance for about three years during the late 70s.
Cash & Treasuries: While usually considered "boring," Cash frequently held the second or third spot in performance rankings because it preserved capital while equities tumbled.
The S&P 500: For most of this 12-year window, the broader equity market stayed in the bottom half of the performance table.
Why Hard Assets Thrive
In a high-inflation environment, companies struggle because their costs rise and high interest rates eat into their margins. This "kills" growth. However, physical assets like Gold and Commodities thrive because they represent "real" value that cannot be printed. As the US dollar fluctuates and debt levels rise, investors flee to these "safe havens" to protect their purchasing power.
Looking Ahead: The Next 5 to 10 Years
While this doesn't mean you should abandon equities entirely, the data suggests a rebalancing of expectations. We are likely entering a decade where the "outperformance" will come from Commodities and Gold rather than the tech-heavy indices we've grown used to.
If history is our guide, being "heavy" on hard assets and "light" on growth-dependent equities might be the survival strategy for the late 2020s.
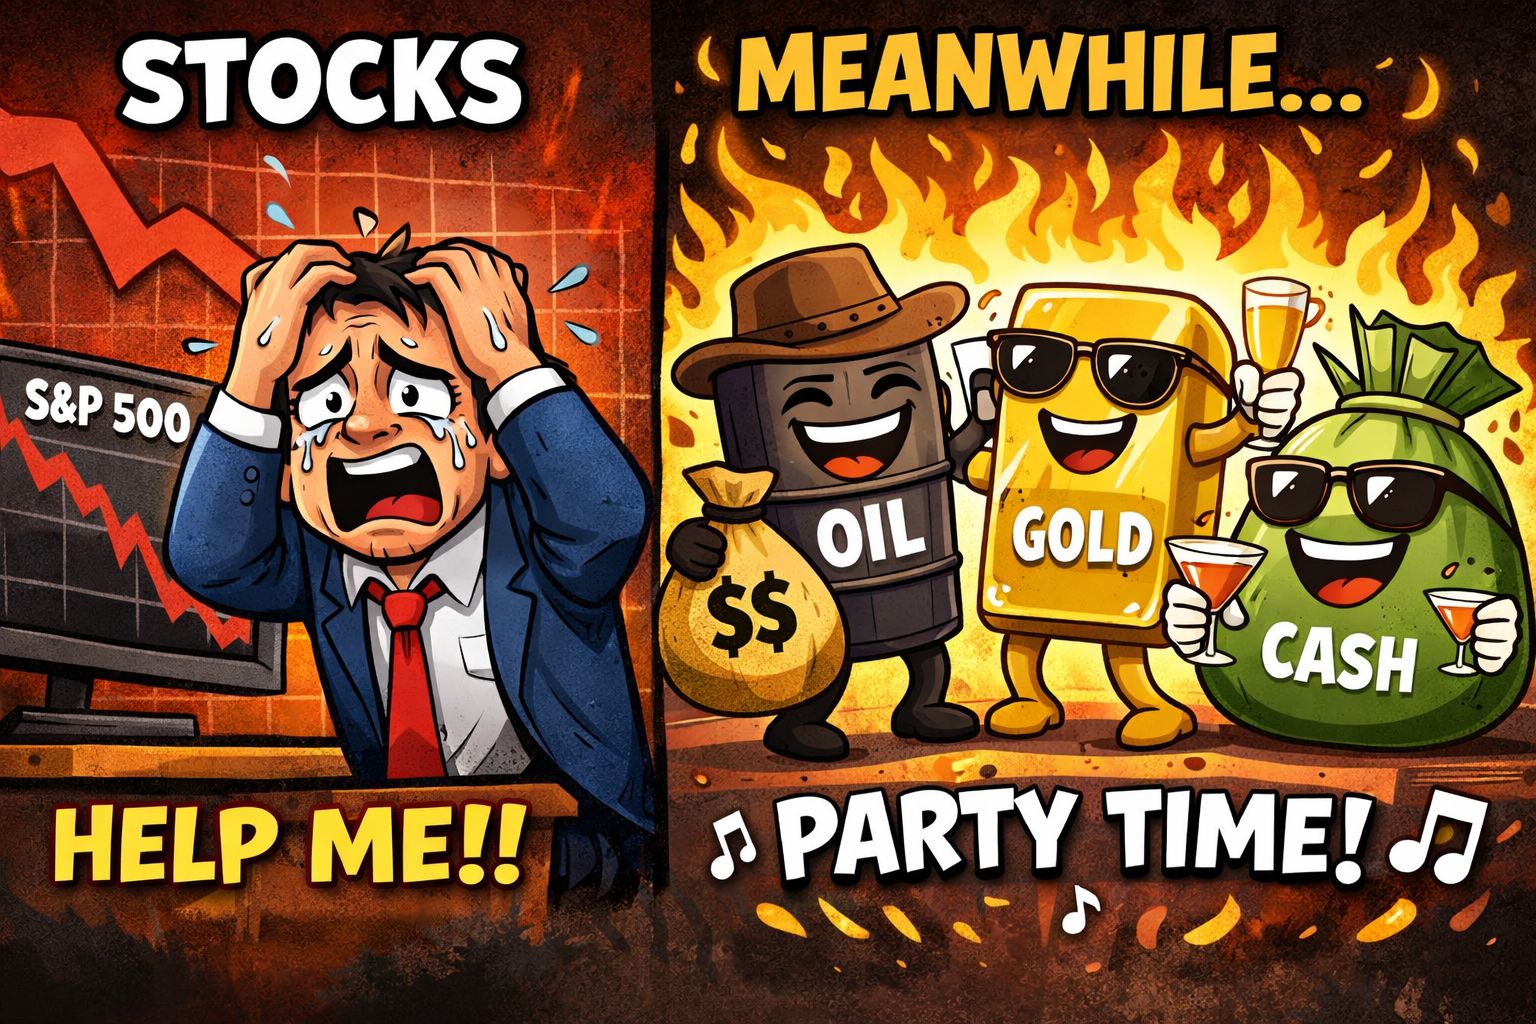
Meme Of The Day
If we are entering a similar 10-year cycle today, where are you putting your "Safe Haven" money? |
|

Share this daily insightful newsletter with your market savvy friends and family or sign them up for the newsletter !
For detailed blogs, reports and strategies, check WeekendInvesting.com
Reply