- WeekendInvesting
- Posts
- Is the US Dominance Nearing its Peak?
Is the US Dominance Nearing its Peak?
The Great Global Shift
WeekendInvesting Analytics
January 12, 2026

Market Update - Monday, 12 Jan
The global landscape is currently facing significant turmoil following a weekend of major developments. A central point of tension has emerged as the Federal Reserve Chair openly criticized the politicization of central bank decisions.
In response to these tensions and the looming specter of conflict with Iran, precious metals and commodities have surged. Gold has reached 4,600 dollars, while silver has climbed past 84 dollars. This flight to safety is a direct reaction to the high-risk scenario currently facing the world economy.
After dipping to 25,400 at midday, the Nifty staged a sharp recovery to close at 25,790, a 300-point reversal that may represent a dead cat bounce.
Other indices showed mixed results, with the Nifty Junior up 0.3% and Mid Caps closing down 0.17%.
The Small Cap space remains particularly weak, with short, mid, and long-term trends all currently negative.
Conversely, the Nifty Bank remains the strongest performer among indices, closing up 0.34% with positive mid and long-term outlooks.

Other Market Triggers
Within the sectors, metals and commodities led the gains, with Hindustan Zinc and Vedanta rising 3.5% and 2.8% respectively.
Other strong performers included JSW Energy, Tata Power, and PFC. On the heavyweights' side, SBI, Bharti Airtel, TCS, and Reliance all recovered from negative territory, while Infosys remained down.
A notable mover of the day was Tejas Networks, which saw a dramatic decline following a revenue drop of 88% and significant quarterly losses. This highlights the effectiveness of momentum strategies, which often exit such stocks well before catastrophic news hits the public.
US Market Updates
In the US markets, several companies showed strength on January 9th, including Intel Corporation, which rose 11%, and Oracle, which gained 4.9%.
The Nasdaq heat map also indicated strong performances from Google, Meta, Amazon, and Tesla, despite some losses in AMD and Nvidia.
These market movements reflect the ongoing shift in global asset allocation.
While some of these stocks may be part of company strategies, these mentions are not formal recommendations.
What to watch next ?
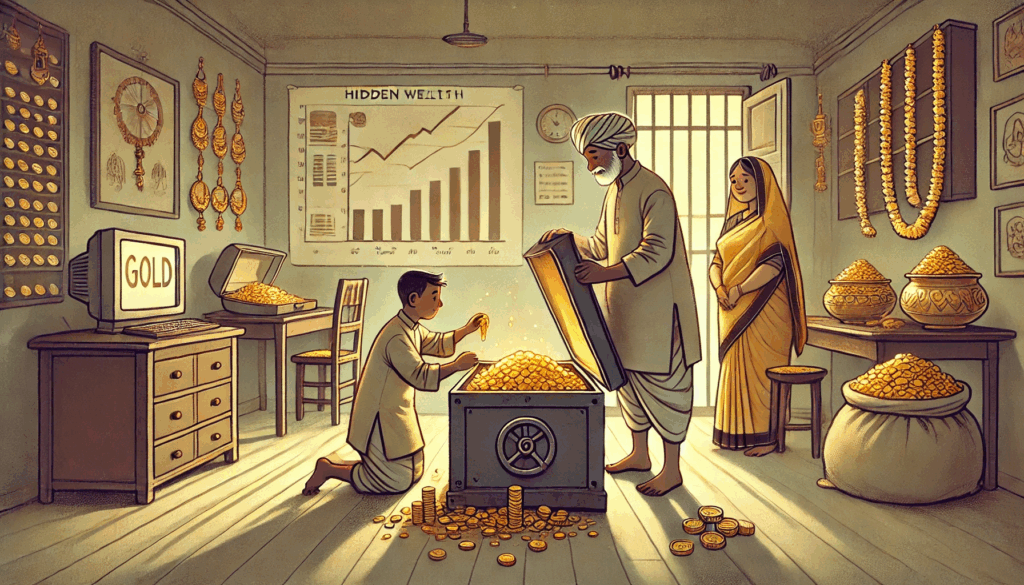
The potential for gold remains vast, as it is estimated that private wealth worldwide—totaling 350 trillion dollars—currently has less than half a percent exposure to the metal.
If global private wealth shifts toward a 5% or 10% allocation in gold, the upward trend could last for the next decade.
Get your Portfolio Momentum Report today and ensure your investments are positioned for success!

For more details about Category 3 AIFs, fill in the interest form below

Important Announcement
We are now live on our official WhatsApp Channel. We share all our strategy updates, rebalances, and important announcements here. Please watch this video to know more & join in at the earliest possible.
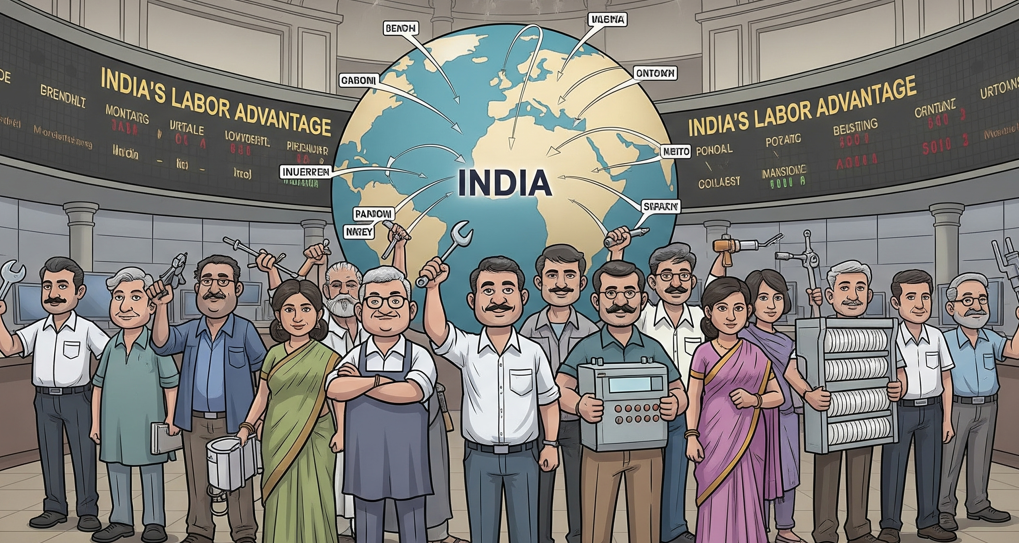
🌍 The Great Global Shift: Is the US Dominance Nearing its Peak?
The investment landscape of today looks nothing like it did 40 years ago. Data recently shared by @Meb Faber on X reveals a staggering shift in how the world’s wealth is distributed across stock markets.
As we look at the trajectory of the last four decades, a crucial question arises: Are we on the verge of another massive rotation?
The Unprecedented Rise of the US Juggernaut
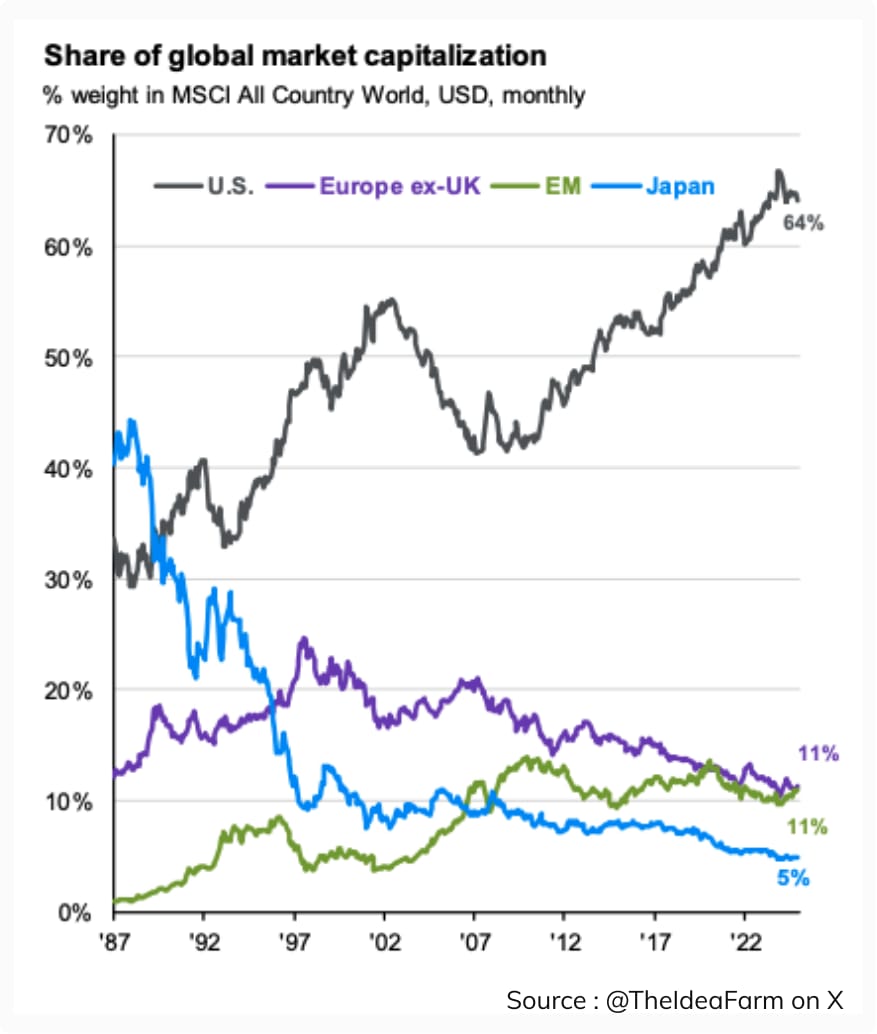
Forty years ago, the US accounted for roughly 30% of the total world market cap. Fast forward to today, and that "black line" on the chart has soared to a dominant 64%. This growth is described as "unprecedented," as the US has essentially sucked the air out of other rooms in the global house. However, history suggests that when one market becomes this heavy, the weight of its own maturity—and high valuations—often leads to a slowdown.
The Rise and Fall of Japan and Europe
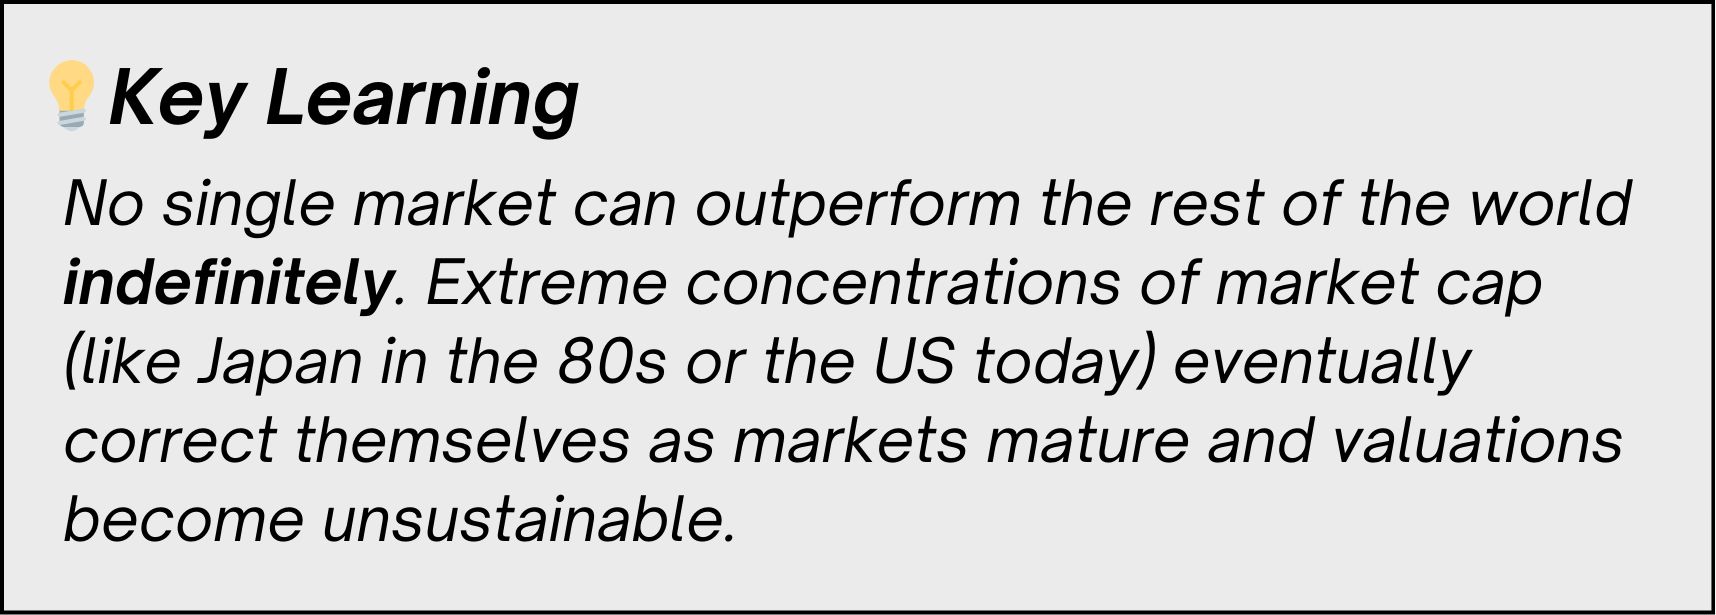
The most dramatic cautionary tale in this data is Japan. In the late 1980s, Japan was the king of the world, commanding 40% of the global market cap. Today? It has shriveled to just 5%.
Similarly, Europe (excluding the UK) saw a rise from 10% to nearly 23% a few decades ago, only to slide back down to 11% recently. These figures remind us that market leadership is never permanent; it is a revolving door.
The Emerging Market (EM) Growth Story
While the giants of the past century have struggled, Emerging Markets have been the quiet winners of the long game. Starting from a negligible 1-2%, EM has climbed to 11% of the world market cap. If the trend of US maturity follows the path of Japan and Europe, EM is the most likely candidate to pick up the mantle.
The Valuation Trap: 25x Earnings
Many market commentators point to a "danger zone" in valuations. Historically, when the US market reaches a price-to-earnings (P/E) ratio of 23x to 25x, the following decade often yields zero to minimal returns. With US markets currently stretched, the "Relative Attractiveness" of other markets—specifically Emerging Markets—becomes impossible to ignore.
The big question for the next 40 years: Can Emerging Markets jump from 11% to 25-30% while the US reverts back to its 30% mean? The data suggests the pendulum is ready to swing.
Meme Of The Day


Share this daily insightful newsletter with your market savvy friends and family or sign them up for the newsletter !
For detailed blogs, reports and strategies, check WeekendInvesting.com
Reply