- WeekendInvesting
- Posts
- Is Today's Move Really A "DEAD CAT BOUNCE" ?
Is Today's Move Really A "DEAD CAT BOUNCE" ?
Why Markets Bounce Back
WeekendInvesting Analytics
March 16, 2026

Market Update - Monday, 16 Mar
The trading week commenced with significant volatility as the market experienced initial bloodletting. In the very first hour of Monday, March 16th, the Nifty was down by more than 1%, while mid and small-cap stocks saw a decline of almost 2% or more. However, a reversal subsequently started where the Nifty jumped almost 500 points to end the day in green.
While some parts of the market remained red and it is too early to definitively say a bottom has been formed, some positive cues have started to appear.
Specifically, twenty-plus vessels carrying oil and LPG are likely to pass through and arrive in India. Although this activity will essentially have a delayed inflation lag, people are beginning to see raw material costs rise, and once they are up, the down cycle is usually very limited.
The Nifty finished up 1.11% today, though it remains unclear if this is a dead cat bounce or a true bottom.
It is necessary to wait for at least a two-day high to be made and sustained to see if the market can build toward existing gaps, specifically reaching toward 24,500, before declaring a durable bottom.
Currently, market charts are reasonably bad and all momentum indices are pointing downwards.
The Nifty Junior was down 0.35%. A long-tailed candle occurred today, which represents a chance of a reversal; a similar situation happened recently for a day before collapsing, so this could arise again in mid-caps.
Mid-caps showed a significant recovery from the bottom to close 0.37% down, and small-caps followed a similar pattern to close 0.36% down.
All charts are showing a similar pattern of recovery from the day's low and closing near the open, while the Bank Nifty and Nifty were the outliers with net positive gains of 1.22% for the day.
In the commodities space, gold is slipping with a 1% drop to a rate of 15,654. Reports indicate there are significant discounts in the physical gold market, suggesting some selling is moving through.
Silver also fell 4%, and the chart does not look pretty, indicating it could go much lower from here.
Other Market Triggers
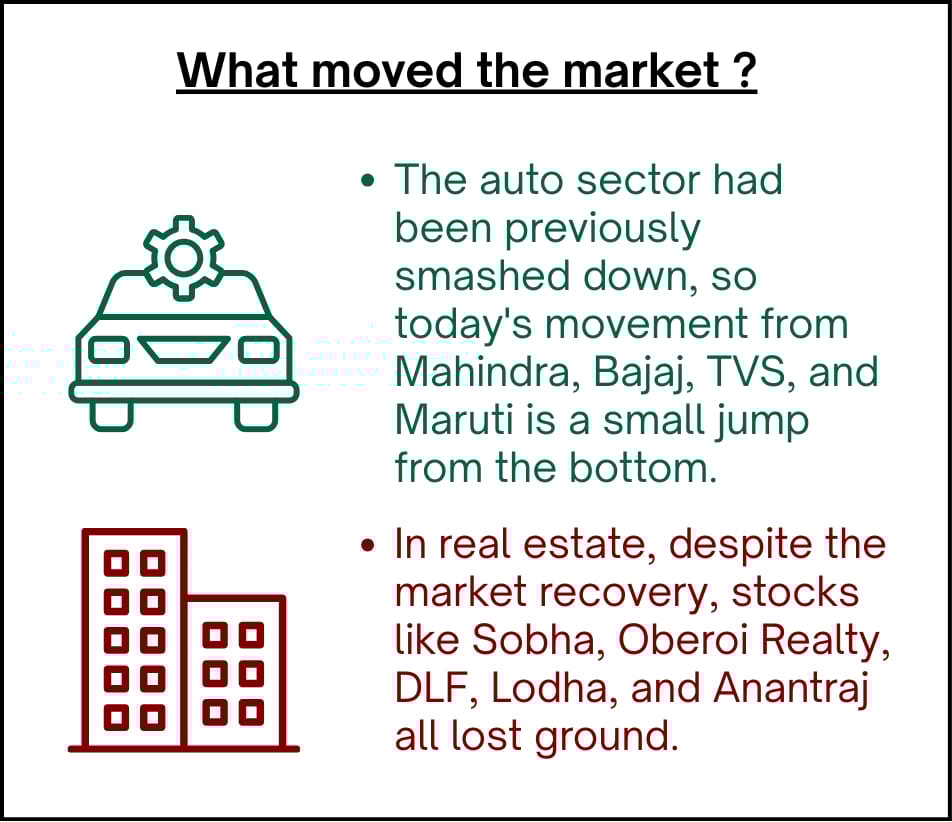
An overview of the heat map shows most of the market was green, with leaders like HDFC Bank, Bajaj Finance, Mahindra, and UltraTech Cement leading the way.
Conversely, some energy and oil companies remained down.
The Nifty Next 50 heat map was less green, though gains were seen in TVS Motors, Adani Power, Shree Cement, and LIC.
Oil companies such as IOC, BPCL, and others like Hindustan Zinc, Torrent Pharma, and Hyundai were smashed down.
In the mover of the day segment, ITI jumped almost 20% at one point and closed up 14.38%.
On the downside, IDBI Bank is tumbling hard as the strategic sale is slightly scrapped, causing the price to drop quickly from 116 to 76 rupees, a 16% decline.
U.S. Market Updates
The previous session in the US markets saw big losses, with Adobe down 7.5%, Broadcom down 4%, and Meta, Salesforce, and Oracle also losing ground.
Overall, US indices were down about half a percent. Some of these stocks, including AVGO, Meta, Apple, Nvidia, Microsoft, Amazon, and Tesla, are part of the Weekend Investing global strategy.
What to watch next ?
The war remains ongoing with Dubai airport shut and bombing continuing. There is a press conference scheduled for tonight, India time, where President Trump may announce a ceasefire.
This is a gut feel based on the announcement of a PR event this evening, and there is hope that some sanity will prevail.

Get your Portfolio Momentum Report today and ensure your investments are positioned for success!

Forwarded this email? Subscribe Now
Top Trending Strategies
Mi EverGreenPower of Gold with Equity | Allocate 20 strongest CNX200 stocks with Gold ETF | Monthly Rebalanced Mi Evergreen is a dynamic strategy which aims to outperform the underlying benchmark CNX200. This index comprises 200 large and mid-cap names which are the top-quality stocks in the markets. This product is suitable for use in all stages of the market cycles as it is designed to invest in the strongest stocks in the pack at any point. Additionally, there is a permanent hedge of Gold available here.
| Mi AllCap GOLDA core strategy to allocate 25% each to Large Cap , Mid Caps, Small Caps & Gold Mi AllCap GOLD is a robust, rule-based core rotational strategy from the House of WeekendInvesting, curated to cover stocks in the CNX500 universe, designed to offer a balanced asset allocation and diversified wealth creation approach for compounding returns over long periods of time.
|


The "Crisis to Recovery" Playbook: Why Markets Bounce Back
Geopolitical tension often feels like the end of a cycle, but history tells a different story. According to recent data shared by ICICI Securities, the knee-jerk reaction to conflict is almost always a correction—yet the subsequent recovery isn’t just a "bounce," it’s often a launchpad for massive gains.
The Anatomy of a Market Shocker
When events like the 9/11 attacks or the Russia-Ukraine conflict occur, the market reacts with immediate "risk-off" sentiment. However, these corrections are historically short-lived compared to the years of growth that follow. For instance, even the catastrophic 9/11 attacks triggered an 18% correction that lasted only two weeks before the market reversed course.
By the Numbers: The Speed of Recovery
The data shows a fascinating trend: the steeper the fear, the more rewarding the recovery. Looking at the averages across major events (Gulf War, Kargil, Pulwama, etc.):
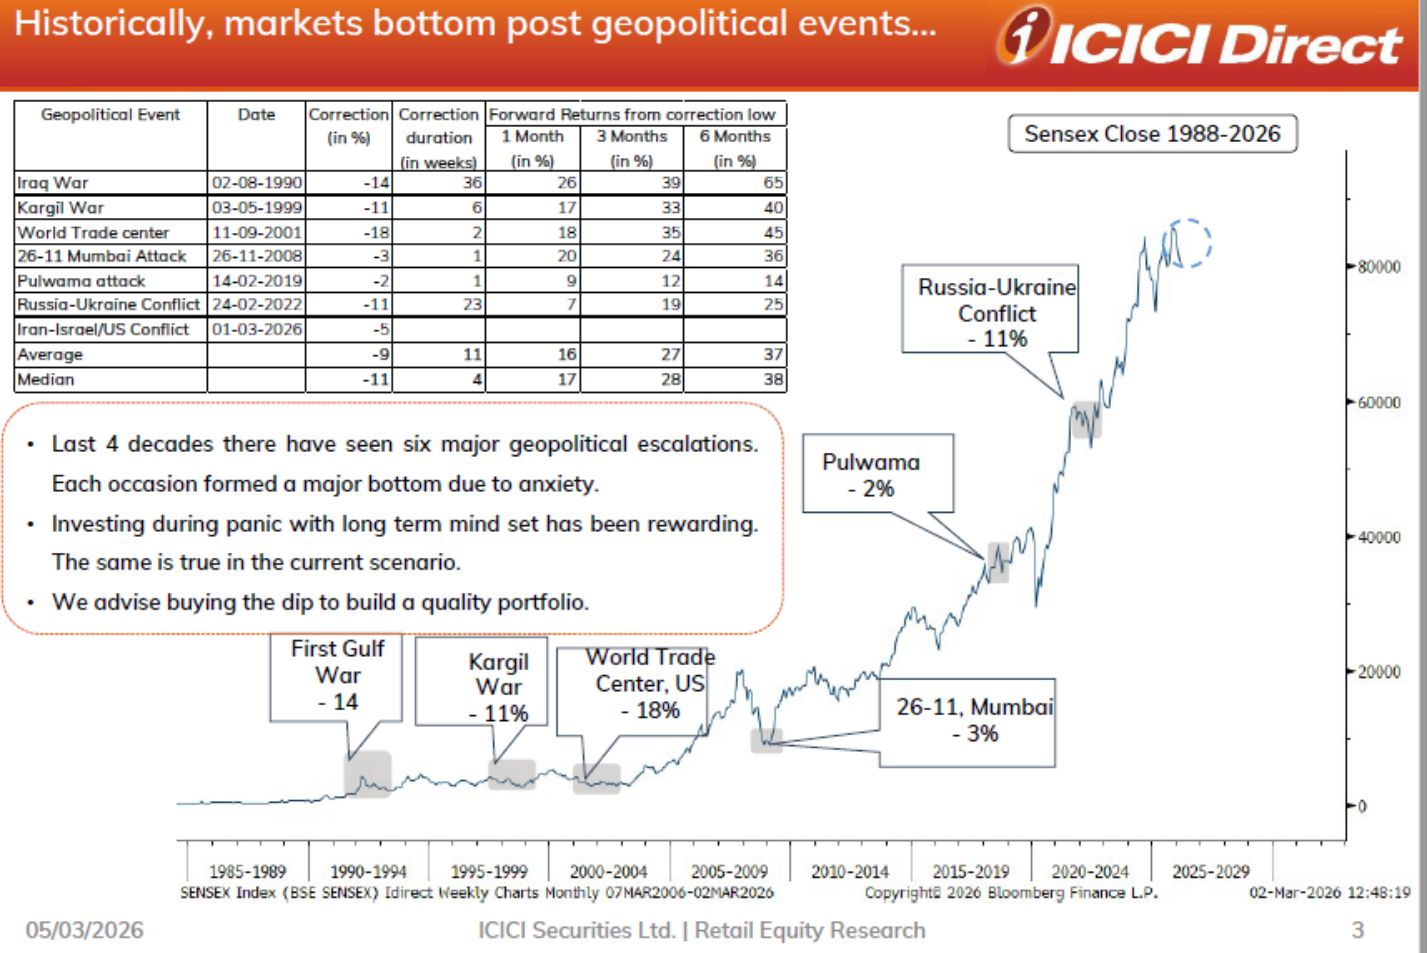
Source : ICICI direct and Debashish Neogi on X
Even in the case of the Russia-Ukraine conflict (2022), where the correction lingered for six months, the recovery was swift, delivering a 25% return shortly thereafter.
Is "This Time" Really Different?
Investors often fall into the trap of thinking the current crisis is unique and will be the one to finally break the market. While we cannot predict the future with 100% certainty, the historical data provides a "confidence anchor."
History suggests that "this time" is rarely different; the market’s underlying mechanism for growth eventually outweighs the temporary noise of geopolitics.
Meme Of The Day


Share this daily insightful newsletter with your market savvy friends and family or sign them up for the newsletter !
For detailed blogs, reports and strategies, check WeekendInvesting.com
Reply