- WeekendInvesting
- Posts
- Its India vs. The World

Market Update - Friday, 9 Jan
The market continues to move on a negative trajectory as the week comes to a close. On this Friday episode, the Nifty has recorded its fifth consecutive red candle, marking a difficult stretch for Indian indices.
The major headline dominating the financial landscape is the U.S. Supreme Court’s pending verdict on the tariff situation, a decision with massive implications for global trade. While the week actually began on a positive note, that optimism was short-lived. In the very first hour of Monday's session, the Nifty scaled a new all-time high of 26,373, but it has been a downward slide ever since.
Looking at the numbers, the Nifty ended the day down 0.75%, closing at 25,683. By breaking below its 50-day moving average, it has moved past a key support level.
Other indices tell a similar story; the Nifty Next 50 fell 1.02%, with two massive red candles essentially wiping out the gains of the previous eight or nine sessions.
Mid-caps followed suit with a 0.88% drop, while the small-cap index saw absolute carnage, falling 1.7%.
Small caps are now struggling near the 16,100 level, a point they had previously fought hard to recover from.
In other asset classes, gold remained relatively stable at 0.16% after a previous fall, consolidating around the 13,734 mark.
Silver, however, showed strength with a 1.93% jump, recovering well after two sessions of profit booking.
Other Market Triggers
While there were small pockets of resilience in IT stocks like TCS and Infosys, and marginal gains in Reliance and ONGC, most other sectors were beaten down.
Auto and consumer stocks suffered in anticipation of the tariff verdict, and real estate was the worst-performing sector of the day, dropping 2.26%.
Major names like Godrej Properties and DLF took a significant hit as the sector fell for the fourth consecutive session.
MTAR Technologies stood out as the mover of the day, surging 6.84% on the back of notable institutional interest.
US Market Updates
Looking at the global landscape, the U.S. markets provided a mixed signal based on data from January 8th.
The S&P 500 was virtually flat, moving just 0.01%, while the Dow Jones managed a 0.5% gain.
Broader markets showed more strength, with the small-cap Russell 2000 rising 1.1%. Strong individual performers included Deere & Company, ConocoPhillips, and Lockheed Martin.
While some of these stocks may be part of company strategies, these mentions are not formal recommendations.
What to watch next ?
Finally, it is worth considering the impact of inflation on long-term wealth. Looking at data from 2011 to 2026, the value of 100 rupees has eroded significantly due to inflation, now holding the purchasing power of just 44 rupees.
This highlight is meant to encourage investors to look at their returns through an inflation-adjusted lens.
While many remain hesitant to move funds from traditional fixed deposits to the equity market, history shows that over the last 15 years, mid-caps have delivered an 8% alpha over inflation, while large and small caps have provided around 5% additional growth.
Being smart about beating inflation is essential for true wealth creation.
Get your Portfolio Momentum Report today and ensure your investments are positioned for success!

For more details about Category 3 AIFs, fill in the interest form below

Important Announcement
We are now live on our official WhatsApp Channel. We share all our strategy updates, rebalances, and important announcements here. Please watch this video to know more & join in at the earliest possible.

India vs. The World: Navigating the Performance Cycle
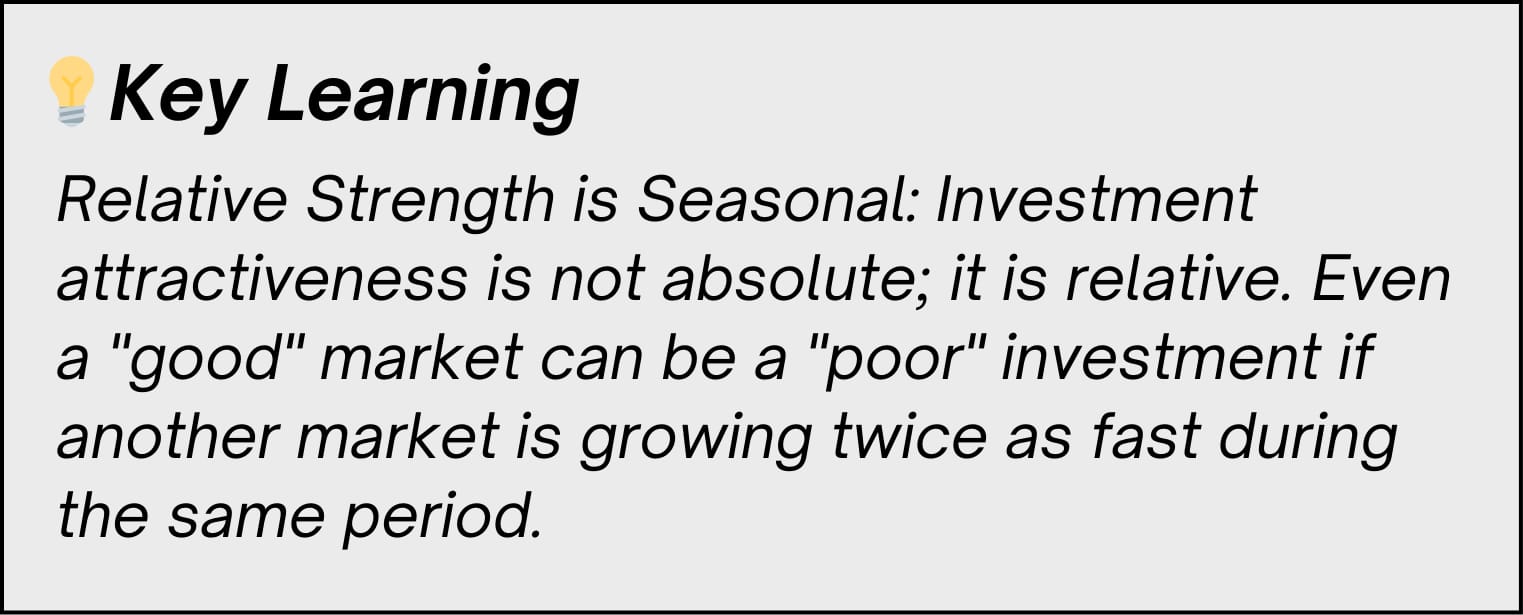
Have you ever wondered why global diversification is such a hot topic, even when the local market feels unstoppable? The answer lies in Mean Reversion and Cyclicality. By analyzing the ratio chart of MSCI India vs. the MSCI All Country World Index (ACWI), we get a clear picture of when India leads the pack and when it’s time to look across borders.
Understanding the Ratio Chart
The ratio chart (India divided by the Rest of the World) is a "Relative Strength" indicator.
When the line goes up: India is outperforming the global markets.
When the line goes down: The rest of the world is performing better than India.
History shows us that these movements aren't random; they move in distinct Up Cycles and Down Cycles.

MSCI India : ACWI Ratio Chart
A Tale of Two Cycles
If we look back at the last decade, the cycles of outperformance have been quite defined:
2013 – 2015: A strong Up Cycle where Indian equities significantly beat global peers.
2020 – 2023: Another massive run where India was one of the best-performing markets post-pandemic.
However, since 2023, the trend has shifted. We are currently in a Down Cycle, meaning while India may still be growing, the rest of the world (led by markets like the US) is offering better relative returns.
The Case for Global Diversification
This chart explains exactly why "Home Bias" can be risky. During India’s down cycles, having exposure to global markets acts as a hedge. It allows your portfolio to capture growth in regions that are currently in their own "Up Cycle," ensuring that your wealth doesn't stagnate just because one specific geography is cooling off.
Looking Ahead: Is the Bottom Near?
The good news? We are approaching a historical Support Zone.
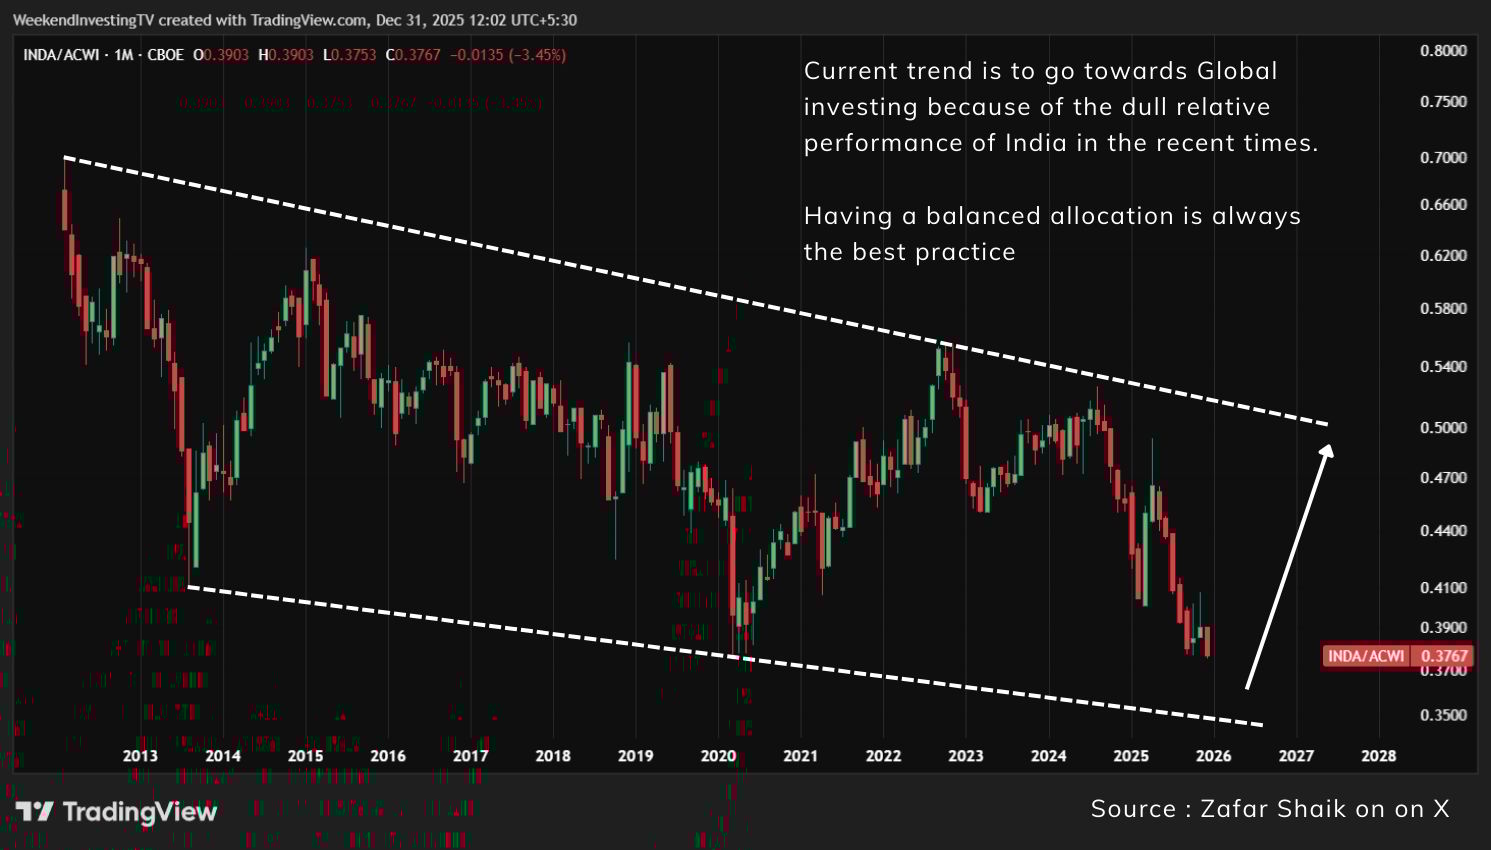
MSCI India : ACWI Ratio Chart
While India might not look like the "star performer" right this second, the tide will eventually turn. Once this ratio bottoms out and starts its reversal, we can expect Indian markets to lead the global rally once again.
Meme Of The Day

How are you positioning your portfolio for the next 12 months? |

Share this daily insightful newsletter with your market savvy friends and family or sign them up for the newsletter !
For detailed blogs, reports and strategies, check WeekendInvesting.com
Reply