- WeekendInvesting
- Posts
- Real Estate vs. Equities : Is History Repeating Itself?
Real Estate vs. Equities : Is History Repeating Itself?
The Great Portfolio Flip
WeekendInvesting Analytics
December 26, 2025

Market Update - Friday, 26 Dec
As the calendar year draws to a close, what initially appeared to be a Santa Claus rally seems to be running out of steam. This is a bitter pill to swallow because the markets saw three consecutive green candles on the 18th, 19th, and 22nd, which have now been followed by three consecutive red candles.
The trend of crude oil is also a point of concern, as it has risen about 5% since December 16. In the last ten days, crude oil has started going up, which further pressures the rupee. Foreign Institutional Investors (FIs) have been continuous sellers once again. Although they were on a hat trick of buying last week on Wednesday, Thursday, and Friday, they have reverted to selling after those three sessions.
This has absolutely been the year of precious metals. Silver is up an absolute 172%, showing massive performance, while gold itself has gone up about 80%. At the start of 2025, we can see how these two precious metals stacked up against the equities. The Nifty 50 is up 10%, mid-caps are up 5%, and small-caps are down about 6.4%.
The Nifty is currently undergoing a correction, trying to come back to the 26,000 level, closing at 26,042 today.
The Nifty Next 50 was the only index in positive territory today at 0.01%, though it still formed a red candle and is hovering near its 40-day moving average.
The mid-cap index is showing a similar pattern of three green candles followed by three red ones, taking support at its 40-day moving average.
Small-caps have been the poorest performers recently, trading well below their all-time highs and their 40-day moving average for a considerable period.
Bank Nifty is down 0.29%, currently at 59,011, and appears to be taking support at its 40-day moving average.
Gold is up 0.76% and silver is up a massive 3.92%.
Other Market Triggers
Nifty’s weakness was primarily attributed to the IT sector, which was the weakest today, losing about 1%.
TCS was down 1.18%, HCL Tech down 0.8%, and Zomato down 1%. Banking stocks were also not spared.
However, the Nifty Next 50 stayed flat, with IRFC and Adani Energy Solutions doing well. IRFC rose 10% on positive news regarding railway ticket price restructuring.
Hindustan Zinc, Ambuja Cements, and Shree Cement also performed well, along with consumer stocks like Varun Beverages and Godrej Consumer Products.
The mover of the day was RVNL, benefiting from the railway fare hikes coming into effect today, December 26. This is expected to increase industry revenue by about 600 crores.
Hindustan Copper rose 8.95%, hitting a 15-year high as copper reached a fresh peak.
What to watch next ?
The Nifty lost about 0.38% today, and while this is not overly pessimistic, the reality is that the market is still waiting for fresh triggers. There are currently not enough tailwinds to drive strong positive momentum for the Indian markets.
This period is also the end of the calendar year, which is usually met with muted volumes that do not augur well for the markets. Perhaps the next important event or trigger will be the earnings season which is set to kickstart very soon.
Get your Portfolio Momentum Report today and ensure your investments are positioned for success!

For more details about Category 3 AIFs, fill in the interest form below
Important Announcement
We are now live on our official WhatsApp Channel. We share all our strategy updates, rebalances, and important announcements here. Please watch this video to know more & join in at the earliest possible.
Top Trending Strategies
Mi EverGreenPower of Gold with Equity | Allocate 20 strongest CNX200 stocks with Gold ETF | Monthly Rebalanced Mi Evergreen is a dynamic strategy which aims to outperform the underlying benchmark CNX200. This index comprises 200 large and mid-cap names which are the top-quality stocks in the markets. This product is suitable for use in all stages of the market cycles as it is designed to invest in the strongest stocks in the pack at any point. Additionally, there is a permanent hedge of Gold available here.
| Mi AllCap GOLDA core strategy to allocate 25% each to Large Cap , Mid Caps, Small Caps & Gold Mi AllCap GOLD is a robust, rule-based core rotational strategy from the House of WeekendInvesting, curated to cover stocks in the CNX500 universe, designed to offer a balanced asset allocation and diversified wealth creation approach for compounding returns over long periods of time.
|
The Great Portfolio Flip: Is History Repeating Itself?
Today, we are diving into a fascinating and unique data point from the US markets that could signal where we are headed next. If you look at the historical data of US household wealth, a very specific pattern emerges between two major asset classes: Real Estate and Equities (Stocks).
Understanding this "tug-of-war" is crucial for any investor trying to navigate the current economic climate.
The 85-Year Cycle: Real Estate vs. Equities
Historically, the net worth of an average US household is divided between various assets. When we plot the percentage of net worth held in Real Estate (the Blue Line) against the percentage held in Equities (the Red Line), we see a distinct cyclical pattern that has played out for over eight decades.
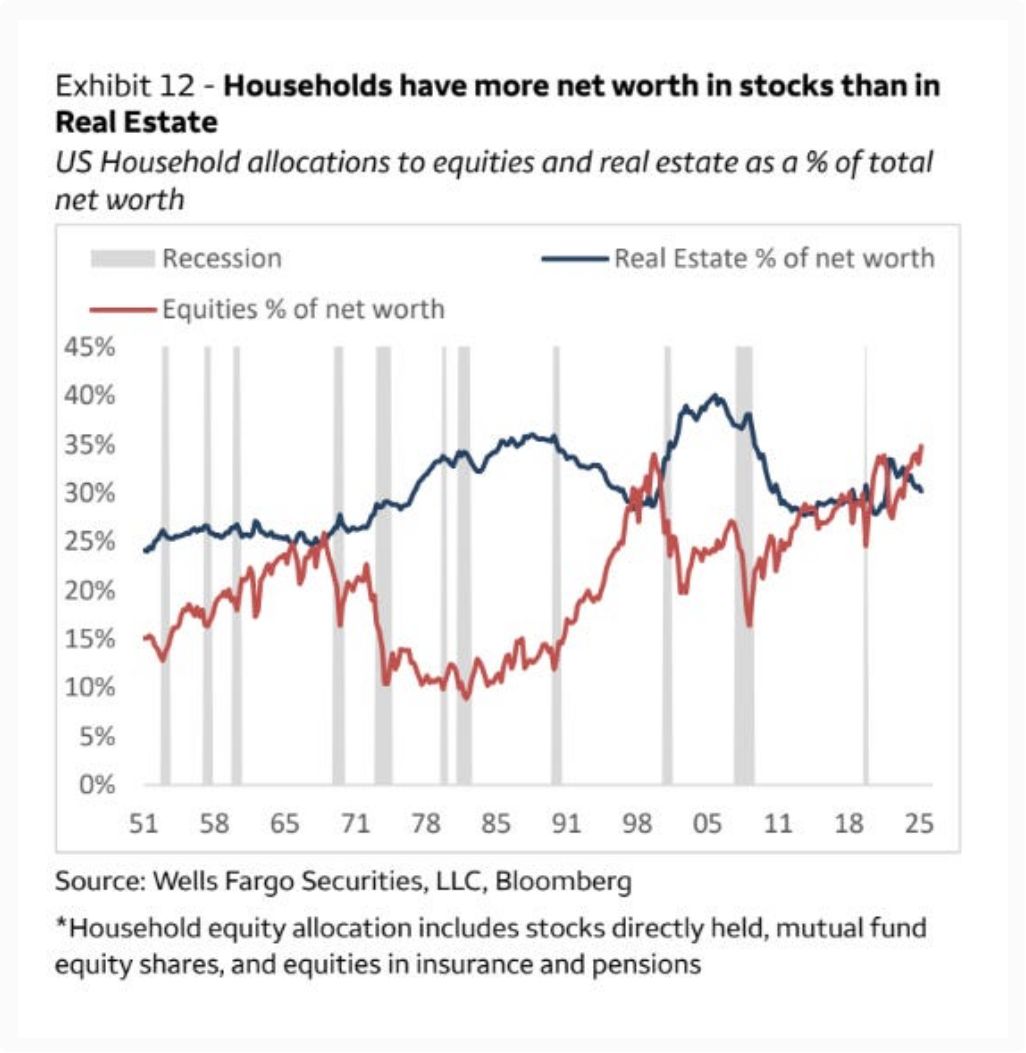
Generally, Real Estate allocation tends to either hover near or stay significantly higher than equity allocation. However, whenever equities "overtake" real estate by a large margin, the market often undergoes a major correction or a reversal.
A Walk Through Financial History
To understand the present, we must look at the pivots of the past:
The 1970s Inflationary Surge: During the 70s and early 80s, high inflation caused real estate prices to skyrocket. Consequently, the "Blue Line" (Real Estate) soared while the "Red Line" (Equities) languished.
The Dotcom Era: Starting in the late 80s, stocks began a massive run-up, culminating in the 2000 Dotcom bubble where equity allocation peaked before crashing.
The 2008 Housing Bubble: From 2003 to 2007, the cycle flipped again. Housing prices reached record highs while equity growth remained relatively modest.
The Post-2010 Recovery: For the last decade, we’ve seen a powerful equity bull market, while real estate—though growing—hasn't kept the same pace in terms of net worth percentage.
Are We at a Tipping Point?
We are currently seeing a situation eerily similar to previous market peaks. Equity allocation has once again crossed above real estate allocation. Historically, such "crossovers" have been followed by recessions or market crashes.
Several factors suggest a reversal might be on the horizon:
Inflationary Pressures: Expected policy shifts (such as potential interest rate cuts) could refuel inflation, which historically favors hard assets like real estate over stocks.
Labor Market Shifts: Recent data shows unemployment is beginning to creep up. If a recession hits, equity valuations often take the first and hardest hit.
The Mean Reversion: If history is a guide, the "Red Line" (Equities) may soon trend downward, while the "Blue Line" (Real Estate) begins its upward ascent.
The Contrast: The Indian Perspective
It is important to note how different this looks in India. While US households are heavily invested in the stock market, Indian household net worth is vastly different:
US: High equity participation makes the economy very sensitive to stock market cycles.
India: Equity allocation is still very low (often estimated at less than 5%), while over 50% of wealth is parked in Real Estate.
Because Indian investors are "under-allocated" in equities compared to their US counterparts, the systemic risk of an equity crash impacting total household net worth is significantly lower in India.
Meme Of The Day
The data shows a historic "crossover" in US household wealth. Where do you think we are headed in 2026? |

Share this daily insightful newsletter with your market savvy friends and family or sign them up for the newsletter !
For detailed blogs, reports and strategies, check WeekendInvesting.com
Reply