- WeekendInvesting
- Posts
- The Secret to Building Real Wealth Through Assets
The Secret to Building Real Wealth Through Assets
Gold’s 25-Year Performance
WeekendInvesting Analytics
April 21, 2026

Market Update - Tuesday, 21 Apr
From time to time, it is essential to recall where the long-term trends lie in the market and for gold. A revision of this data takes place almost every month, and when examining the gold performance over the last 25 odd years, a notable figure emerges: a 14.6% CAGR.
The markets experienced another green day. Although nobody was expecting this kind of a run in the Nifty, it has happened. As always, please read the disclaimer fully and understand it before moving forward. It was another day of upward movement, with a 0.87% gain on the Nifty.
The Nifty Jr was slightly subdued today, up 0.69% and also above the 70,000 mark.
Mid caps were up 0.53%—not really in any rush today, just resting—and there is no problem with that. There was an 0.82% rise on the small cap index.
The Nifty Bank index rose 1.39% on the back of good moves in ICICI and HDFC Bank.
Gold remained absolutely flat at minus 0.34%, and crude oil was also flat at 1.14%.
Other Market Triggers
Advance-decline trends are very much in favor of advances, at 343 to 156.
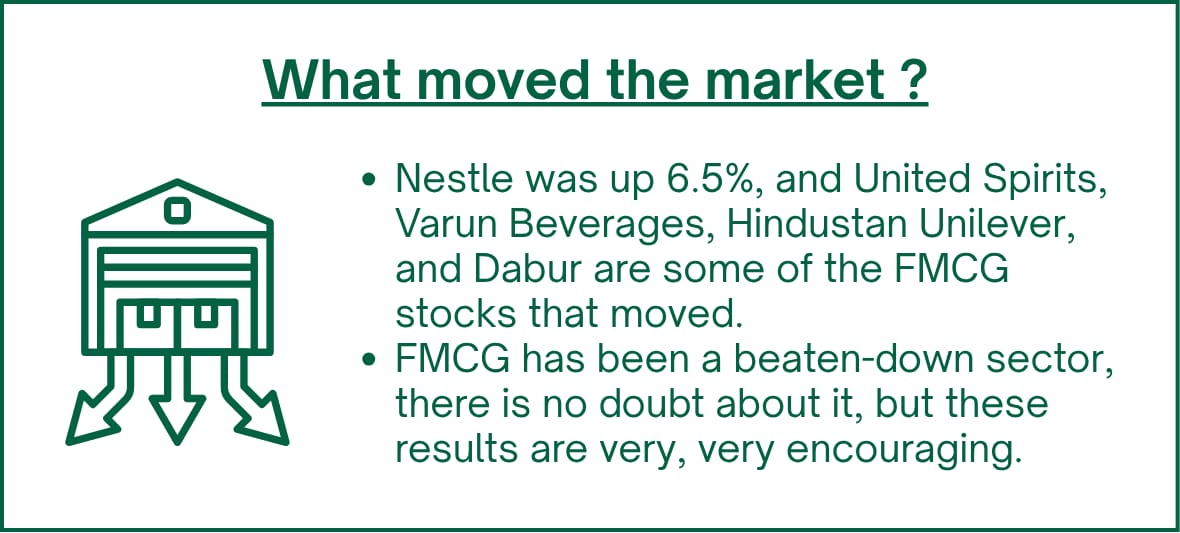
The heat map tells the whole story, showing a massive move in Nestle, ITC, Unilever, ICICI Bank, and HDFC Bank.
Almost all those stocks that were not participating so far were participating today. Therefore, while many portfolios did not move along with the indices, the indices moved because most of the laggards performed well today.
In the Nifty Next 50 heat map, there were good moves again in the FMCG Consumer Non-Durable space, including Pidilite, Godrej CP, Britannia, United Spirits, and Varun Beverages, along with some decent moves from real estate and capital goods stocks.
Some pharma names were in the red, and some commodity stocks were in profit-booking mode.
In the mover of the day segment, PNB Housing moved up 8%, following a dividend announcement of 8 rupees per share and a good quarter four PAT.
Lemon Tree moved up 7% following the latest expansion plans; it has lost a lot of ground in the past, but now it starts to look good when looking at sectoral trends.
U.S. Market Updates
The US markets' previous session was a down session for the S&P 500 and Nasdaq 100, although the Russell 2000 was up by 0.58%.
Intel Corporation lost some ground at 4%, and Meta Platforms, Netflix, FV, and Colgate-Palmolive moved down. Some of these stocks could be a part of the weekend investing US stock strategy, but these are not recommendations.
The general Nasdaq 100 heat map also looks a bit red. Tonight, there is a speech by President Trump, and a lot of rumors are floating around that he may announce a permanent ceasefire, which is what is expected. Bets are being placed in the betting markets on shorting oil and on a ceasefire coming through.
What to watch next ?
Significant moves are occurring without there being any clarity on the ground.
Consequently, many people waiting on the sidelines to jump in once there is clarity will find that once that clarity arrives, there is nothing left in the market to make money out of.
It should be very clear in one’s thought process that the purpose of being here is to take some risk, and that risk-taking ability is the reason why some money will be made.
If one does not want any risk and decides to wait for the day when everything is fine in the world, there will be no money to be made at that point.

Get your Portfolio Momentum Report today and ensure your investments are positioned for success!

Forwarded this email? Subscribe Now
Top Trending Strategies
Mi EverGreenPower of Gold with Equity | Allocate 20 strongest CNX200 stocks with Gold ETF | Monthly Rebalanced Mi Evergreen is a dynamic strategy which aims to outperform the underlying benchmark CNX200. This index comprises 200 large and mid-cap names which are the top-quality stocks in the markets. This product is suitable for use in all stages of the market cycles as it is designed to invest in the strongest stocks in the pack at any point. Additionally, there is a permanent hedge of Gold available here.
| Mi AllCap GOLDA core strategy to allocate 25% each to Large Cap , Mid Caps, Small Caps & Gold Mi AllCap GOLD is a robust, rule-based core rotational strategy from the House of WeekendInvesting, curated to cover stocks in the CNX500 universe, designed to offer a balanced asset allocation and diversified wealth creation approach for compounding returns over long periods of time.
|
The Macro Perspective: Is the Era of Commodities and Gold Upon Us?
We recently came across some compelling data presented by North Star Charts that offers a fascinating 100-year perspective on the financial markets. By analyzing the long-term relationship between Gold and the S&P 500, we can uncover patterns that suggest a significant shift in market leadership.
The 100-Year Signal: A Rare Phenomenon
The data reveals a recurring pattern: four times in the last century, Gold has flashed a clear signal that it—along with the broader commodities complex—is poised to outperform equities.
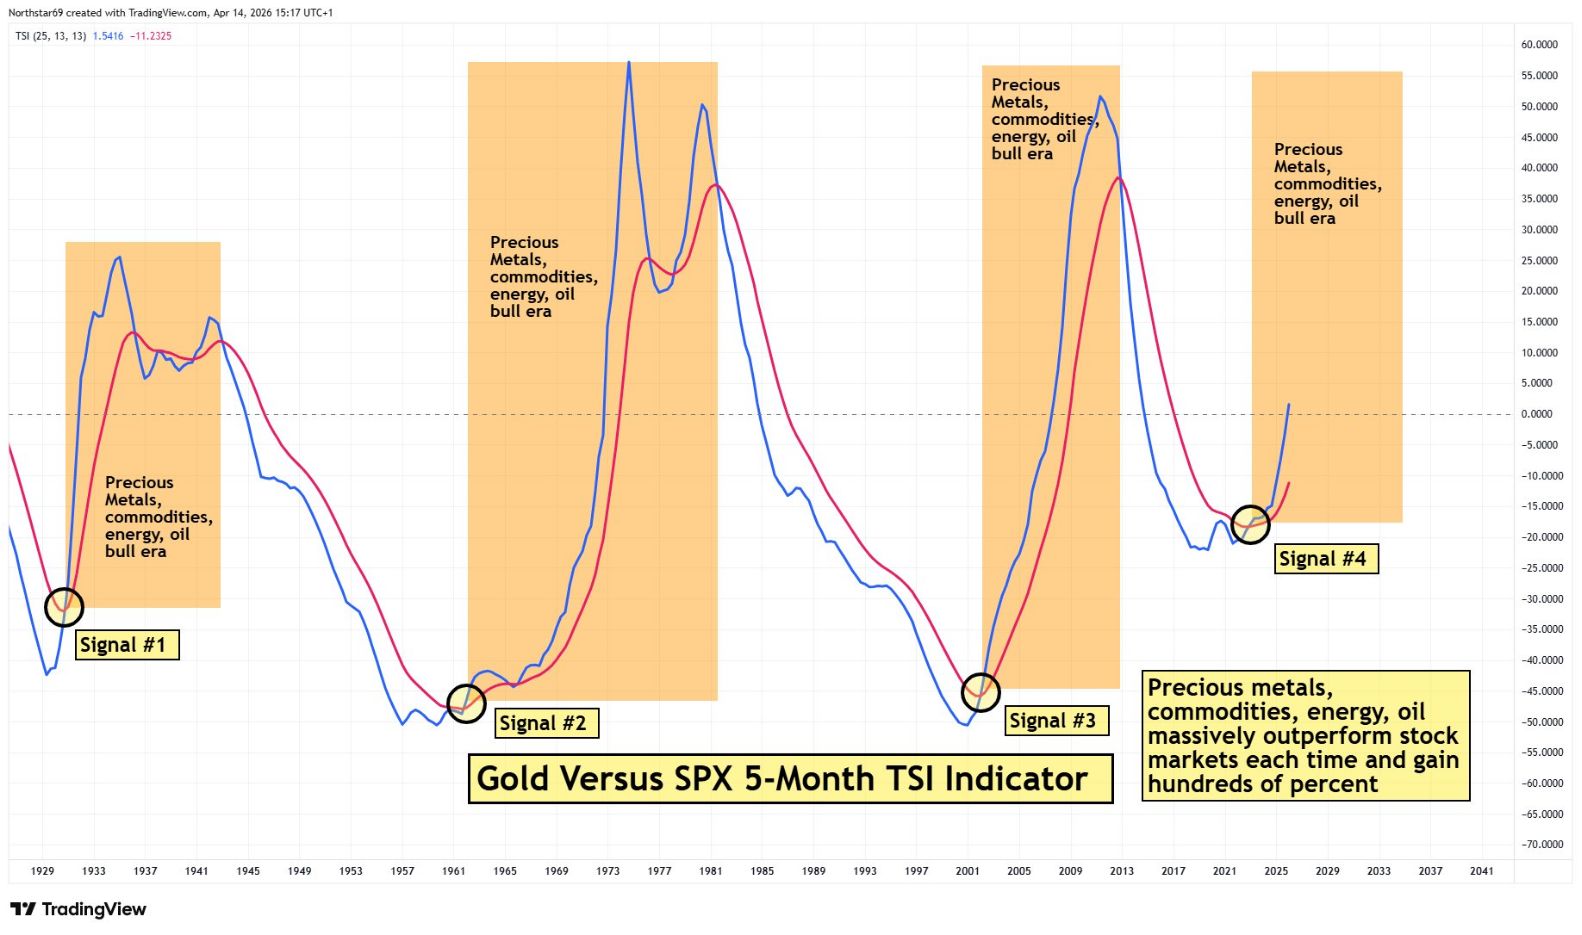
Source : @Northstar Charts
These historical turning points occurred in:
The 1930s
The 1960s
The 2001 Secular Shift
The 2023 Breakout (Current Cycle)
This signal does not suggest that the stock market will crash or that you should stop investing in equities. Instead, it highlights a rotation of leadership. During these periods, assets like Gold, Oil, and Energy stocks tend to deliver explosive, multi-year returns, often significantly outpacing the broader indices.
A Marathon, Not a Sprint
One of the most critical takeaways from this chart is the duration of these trends. These are not short-term blips; they are long-term structural shifts.
1960s-1980s: This signal persisted for nearly 20 years.
Post-2001: The commodity outperformance lasted roughly 12 years.
Current Cycle: We are approximately 2–3 years into this current move.
While there may be short-term fluctuations—where Gold or Oil might remain stagnant for three to six months—the structural evidence suggests this is a long-term journey that is likely just getting started.
Strategic Allocation: Balancing Your Portfolio
Does this mean you should sell all your stocks? Absolutely not. However, it suggests a strategic tilt. When the "Gold vs. S&P 500" indicator trends upward, it implies that your portfolio should be overweight in commodities, energy, and precious metals.
Conversely, when the indicator flips downward—as it did in 1941, 1981, and 2013—the narrative favors traditional mainstream equities, suggesting a higher allocation to the broader stock market and a reduction in commodity exposure.
Meme Of The Day

Based on the historical data showing that Gold and Commodities often enter multi-year outperformance cycles, what is your current strategy for the next 3–5 years? |
|

Share this daily insightful newsletter with your market savvy friends and family or sign them up for the newsletter !
For detailed blogs, reports and strategies, check WeekendInvesting.com
Reply