- WeekendInvesting
- Posts
- Why Crude Surges Might Be a Buy Signal For You
Why Crude Surges Might Be a Buy Signal For You
The Oil Spike Paradox
WeekendInvesting Analytics
March 24, 2026

Market Update - Tuesday, 24 Mar
In a market climate where such sights have become rare, today offered a much-needed relief day as green returned to the screens. The Nifty moved up, and across the board, all market segments saw gains. While this relief rally is a welcome change, it doesn’t necessarily signal that the worst is over.
It is often only with the benefit of hindsight, a few days later, that one can confirm if a bottom was truly formed. Pinpointing whether a pullback like this will stick or if it is merely a "dead cat bounce" remains difficult in the moment.
Regarding the current market trajectory, today's small bounce of 1.78% is positive but should be viewed in context. The market remains in a short, mid, and long-term downtrend, having lost nearly 3500 points from its peak. We have only bounced approximately 500 points from the bottom, so it is too early for a full celebration. A sustainable recovery would require a consistent rally that successfully takes out previous highs; a similar attempt four days ago failed to hold.
The Nifty Next 50 (Nifty Junior) rose 1.54%, while Mid caps and Small caps both climbed roughly 2.4% to 2.5%.
Mid caps looked particularly strong, nearly erasing the previous day's intraday losses.
The Bank Nifty rose 2.2%, closing above the previous day’s open, though several gaps still need to be filled.
In the commodities space, Gold is inching up. After reaching nearly 130,000 per 10 grams, it is currently moving toward 14156. While the longer-term trend for Gold remains intact, the immediate chart appears weak.
Silver also rose 2.11%, with long candles from the previous day suggesting a potential bottom, though it is too early to be certain.
Other Market Triggers
Large-cap names like HDFC Bank, ICICI Bank, Eicher Motors, Mahindra, Infosys, and Unilever showed strength.
Conversely, Coal India, Power Grid, and Adani Enterprises lost ground. Interestingly, ITC stayed relatively flat with a 0.28% gain, while Reliance and State Bank of India also remained subdued.
The Nifty Next 50 heat map showed broad gains, with Motherson, Bosch, ABB, LIC, and DLF performing well.
In the "mover of the day" segment, SPL Petro rose 8.5%. Specialty chemical stocks are showing resilience, which is a key indicator of relative strength.
Stocks like Aether Industries—which has risen from 900 to nearly 1200 since the war broke out 20 days ago—demonstrate that positive developments are happening internally despite broader market stress.
U.S. Market Updates
In the US, all indices closed higher in the previous session. This followed comments from President Trump regarding a five-day delay in potential actions against Iran's energy infrastructure to allow for negotiations.
While some interpreted this as a "taco trade" or a sign of hesitating on previous intentions, the markets reacted positively.
Companies like Palantir, Lowe's, Broadcom, General Motors, and 3M saw moves between 3% and 6%.
The Nasdaq 100 heat map was also green, with Tesla, Amazon, Meta, Palantir, Netflix, Avgo, and Nvidia all gaining. Some of these names may be part of the Weekend Investing US stock strategy, though this is not a formal recommendation.
What to watch next ?
A recent case study involving Cohance Life Sciences highlights the importance of an exit strategy. Over five years, this stock rose from 100 rupees to 1400, only to fall back to 300.
There is a time to be invested and a time to be out. Many investors engage in "bottom fishing" during a crash, but it is often better to let the chart structure rebuild an upward trend rather than "catching a falling knife."
Those who tried to buy the dip at various stages of the decline may now be down 60% to 70%. Experience with tens of thousands of investors over 30 years shows that investing without a clear plan for entry and exit leads to significant losses.

Get your Portfolio Momentum Report today and ensure your investments are positioned for success!

Forwarded this email? Subscribe Now
Dear Investors,
Happy to inform you that we’re moving to a WhatsApp Community to make your experience simpler, more seamless, and easier to access all updates in one place.
Inside the community, you’ll continue to get Rebalance Alerts, Weekly Review & Analysis, Market Nuggets, Daily Bytes, Story-Driven Content, New Launches & Offers, and Special Events & Announcements - all organized for better visibility and ease of use.
Top Trending Strategies
Mi EverGreenPower of Gold with Equity | Allocate 20 strongest CNX200 stocks with Gold ETF | Monthly Rebalanced Mi Evergreen is a dynamic strategy which aims to outperform the underlying benchmark CNX200. This index comprises 200 large and mid-cap names which are the top-quality stocks in the markets. This product is suitable for use in all stages of the market cycles as it is designed to invest in the strongest stocks in the pack at any point. Additionally, there is a permanent hedge of Gold available here.
| Mi AllCap GOLDA core strategy to allocate 25% each to Large Cap , Mid Caps, Small Caps & Gold Mi AllCap GOLD is a robust, rule-based core rotational strategy from the House of WeekendInvesting, curated to cover stocks in the CNX500 universe, designed to offer a balanced asset allocation and diversified wealth creation approach for compounding returns over long periods of time.
|

The Oil Spike Paradox: Why Crude Surges Might Be a Buy Signal
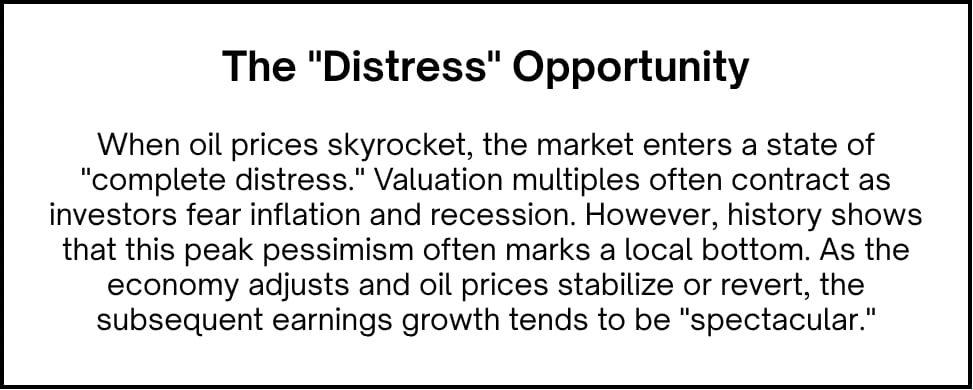
In the world of investing, a sudden spike in crude oil prices is usually greeted with panic. Higher energy costs act like a "stealth tax" on consumers and corporations alike. However, historical data suggests that for the patient investor, these moments of distress often precede periods of significant market outperformance.
The 20% Rule: A Look at the Data
A recent study by the kobeissi Letter analyzed every instance over the last 40 years where crude oil prices surged by 20% in a very short timeframe.
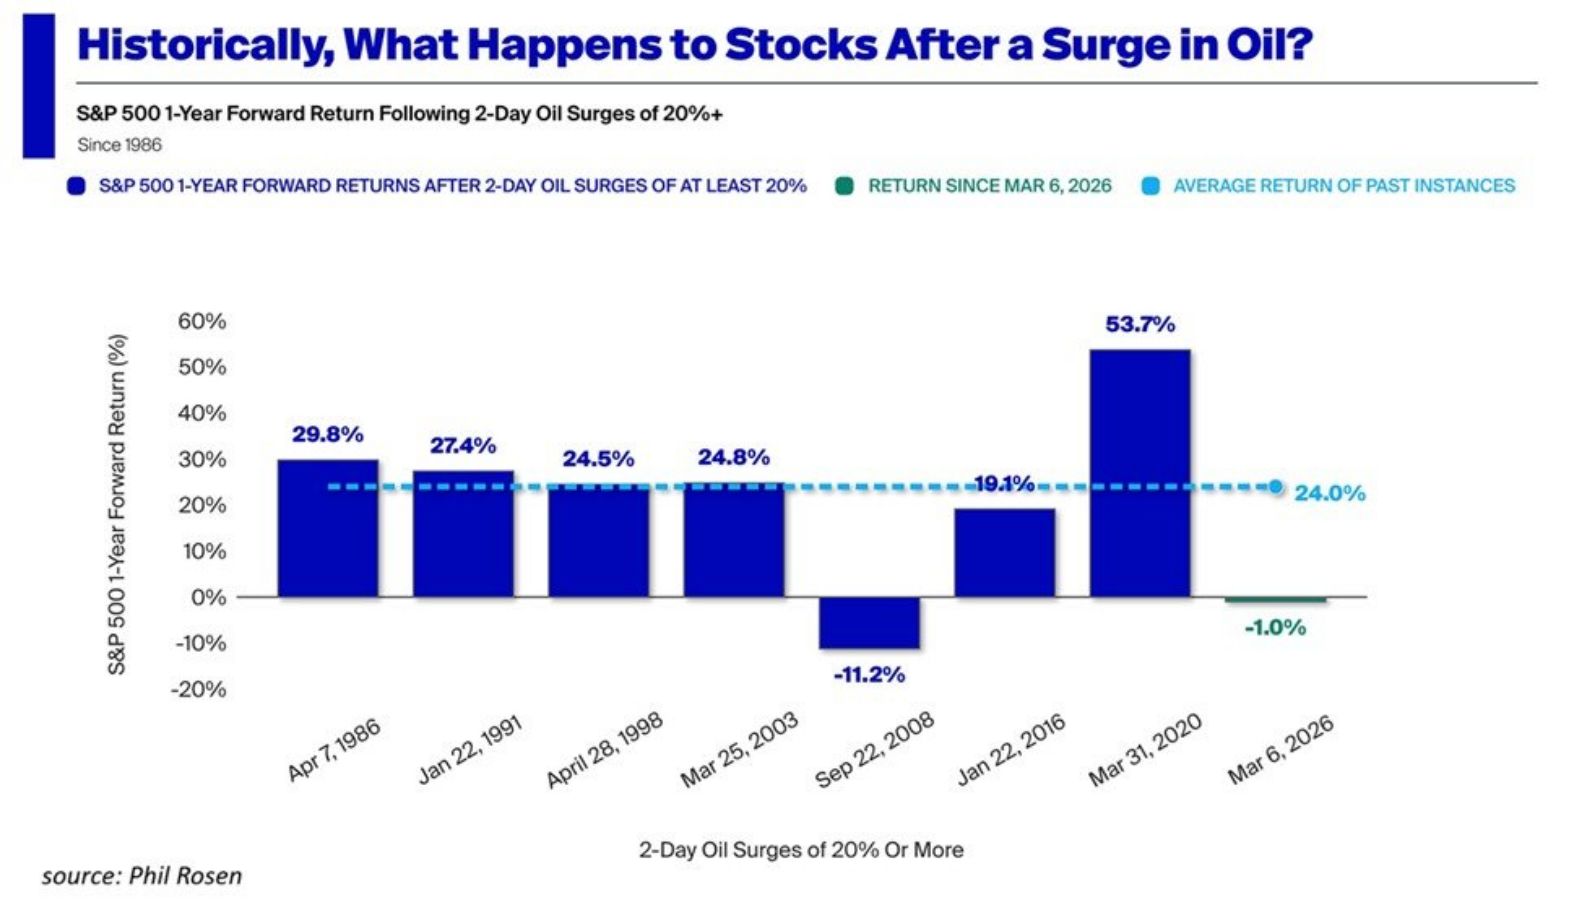
Source : Kobeissi Letter on X
While the immediate reaction is often market "distress," the one-year forward returns for the US markets tell a different story.
From 1986 to 2026, the S&P 500 has shown a resilient ability to bounce back after energy shocks.
Historical Performance Post-Spike
Aside from the outlier of the 2008 Global Financial Crisis (GFC), the market's recovery after an oil shock has been consistently robust. (see the image above)
On average, the US market has climbed 24% in the year following a major crude spike. This trend isn't exclusive to the States; similar patterns have been observed in the Indian markets, where forward returns over 1, 3, and 5-year horizons remain exceptionally strong following energy-induced distress.
Meme Of The Day

Share this daily insightful newsletter with your market savvy friends and family or sign them up for the newsletter !
For detailed blogs, reports and strategies, check WeekendInvesting.com
Reply