- WeekendInvesting
- Posts
- Why the Gold's "Top" Might Still Be Miles Away
Why the Gold's "Top" Might Still Be Miles Away
The Golden Renaissance
WeekendInvesting Analytics
December 30, 2025

Market Update - Tuesday, 30 Dec
With only one day remaining in the year, it is a good time to reflect on the market's performance. This year has been a period of consolidation and has felt relatively slow compared to the heavy lifting seen in previous years.
However, a consolidation year is not a bad deal, as investors often feel the market is underperforming only because they focus on the very short term.
The Nifty reached a low of 25,878 during the day but recovered about 50 to 60 points from that level by the close. This marks the fifth day of general listlessness and weakness.
The Nifty Junior also remained flat with a minor gain of 0.04%. Its short-term move is negative, though the mid and long-term outlooks appear positive.
In the mid-cap space, the market saw its fifth day of downward movement with a recovery from the bottom to close at minus 0.18%. Here, the short and mid-term momentum is negative, while the long-term stays positive.
Small caps moved down 0.2%, showing negative short-term and long-term scores, though the midterm is currently positive. The negative long-term sign for small caps is a point of note.
Nifty Banks, however, moved up 0.41% with positive short and long-term momentum, even though the medium term remains in negative or range-bound territory.
Gold has seen its short-term momentum turn negative, but its mid-term and long-term trends are very positive. Gold rose 0.77% today after a significant cut yesterday.
Silver experienced a major crash yesterday, opening 5% to 6% higher before dropping 10%, but it is up 3.5% today. Despite the volatility, silver’s short, mid, and long-term momentum all remain positive on the charts.

Other Market Triggers
Significant cuts were seen in technology, energy, and some FMCG stocks.
On the positive side, gains were recorded in Bharti, Mahindra and Mahindra, Bajaj Auto, Tata Steel, JSW Steel, State Bank, Axis Bank, and Shriram Finance.
In the Nifty Next 50 heat map, companies like Adani Power, Jindal Power, Jindal Stainless, Vedanta, TVS Motors, PNB, and Canara Bank did well.
Losses were noted in stocks like ABB, Siemens, Mazdoc, which lost 3%, as well as DLF, IRFC, ITC, REC, and Naukri.
Hind Copper is currently moving very rapidly, climbing from 375 to almost 550 in about a week. After a big gap up and subsequent closing of that gap yesterday, it rose 9.42% today to reach 533.
US Market Updates
In the previous US market session, all major indices were down between 0.3% and 0.6%. Tesla crashed 3.2%, Palantir dropped 2.4%, and financial stocks like Citigroup, Goldman Sachs, and American Express fell between 1% and 2%. Some of these stocks may be part of the Weekend Investing US stock strategy, though these are not recommendations.
The NASDAQ 100 heat map showed Nvidia, Avgo, Netflix, and Cisco moving down, while Apple, Google, Microsoft, and Amazon remained flat.
What to watch next ?
Cycles usually consist of two years of very high returns followed by a three-year lull.
This is the mindset one should adopt when looking back at 2025 and looking forward to 2026. The current 15-month period of consolidation represents a healthy time correction.
It suggests that the market is 15 months closer to a potential bottom from which it can begin to move upward again, which serves as a silver lining for investors.
Get your Portfolio Momentum Report today and ensure your investments are positioned for success!

For more details about Category 3 AIFs, fill in the interest form below
Important Announcement
We are now live on our official WhatsApp Channel. We share all our strategy updates, rebalances, and important announcements here. Please watch this video to know more & join in at the earliest possible.
Top Trending Strategies
Mi EverGreenPower of Gold with Equity | Allocate 20 strongest CNX200 stocks with Gold ETF | Monthly Rebalanced Mi Evergreen is a dynamic strategy which aims to outperform the underlying benchmark CNX200. This index comprises 200 large and mid-cap names which are the top-quality stocks in the markets. This product is suitable for use in all stages of the market cycles as it is designed to invest in the strongest stocks in the pack at any point. Additionally, there is a permanent hedge of Gold available here.
| Mi AllCap GOLDA core strategy to allocate 25% each to Large Cap , Mid Caps, Small Caps & Gold Mi AllCap GOLD is a robust, rule-based core rotational strategy from the House of WeekendInvesting, curated to cover stocks in the CNX500 universe, designed to offer a balanced asset allocation and diversified wealth creation approach for compounding returns over long periods of time.
|
The Golden Renaissance: Why the "Top" Might Still Be Miles Away
Every time Gold rallies, a familiar chorus begins: "It’s gone too high," "A correction is overdue," or "The top is in."
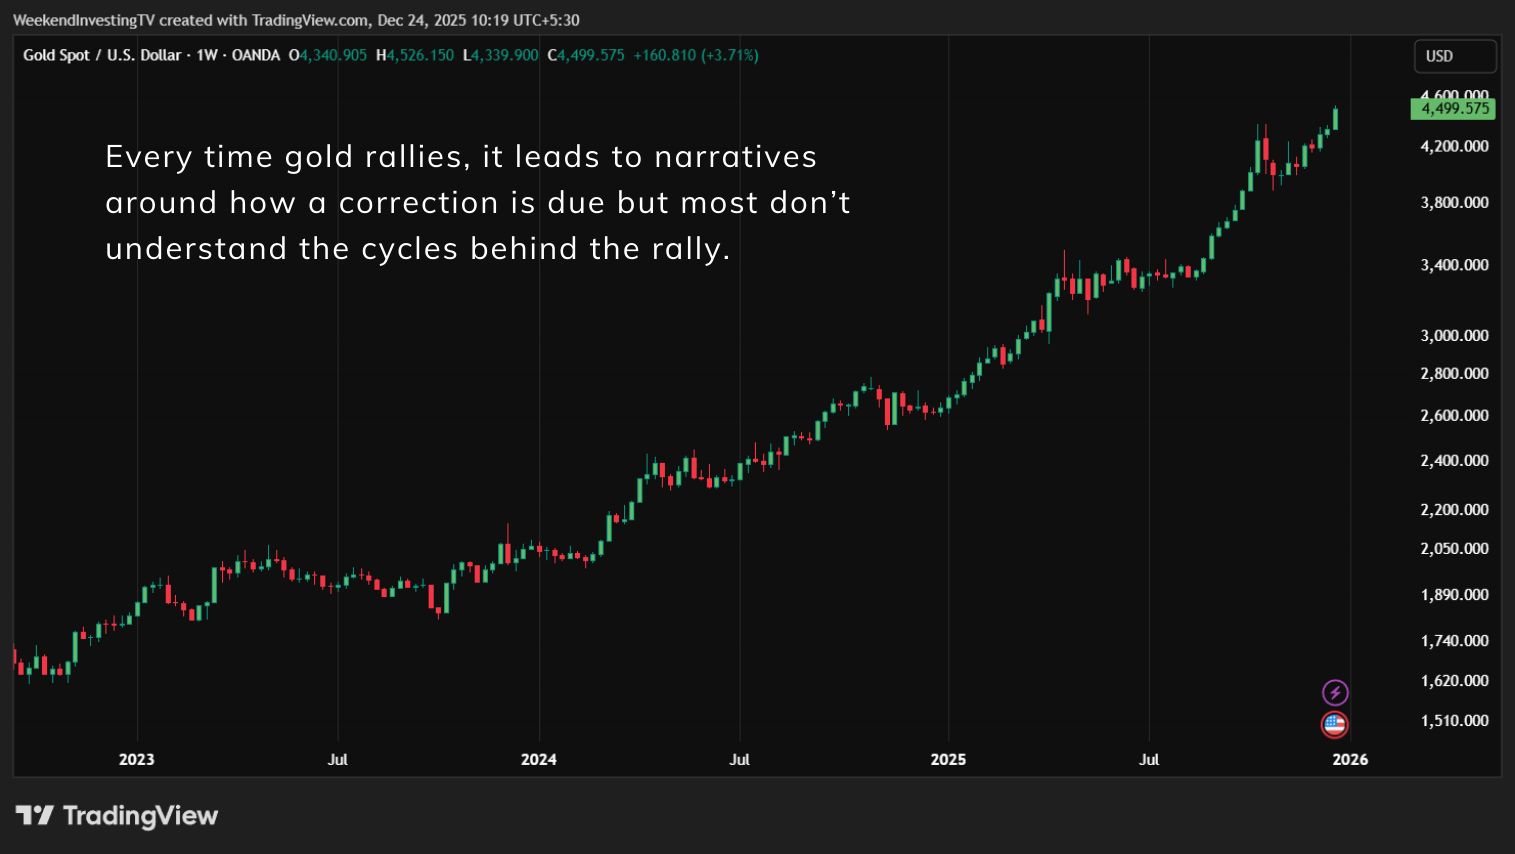
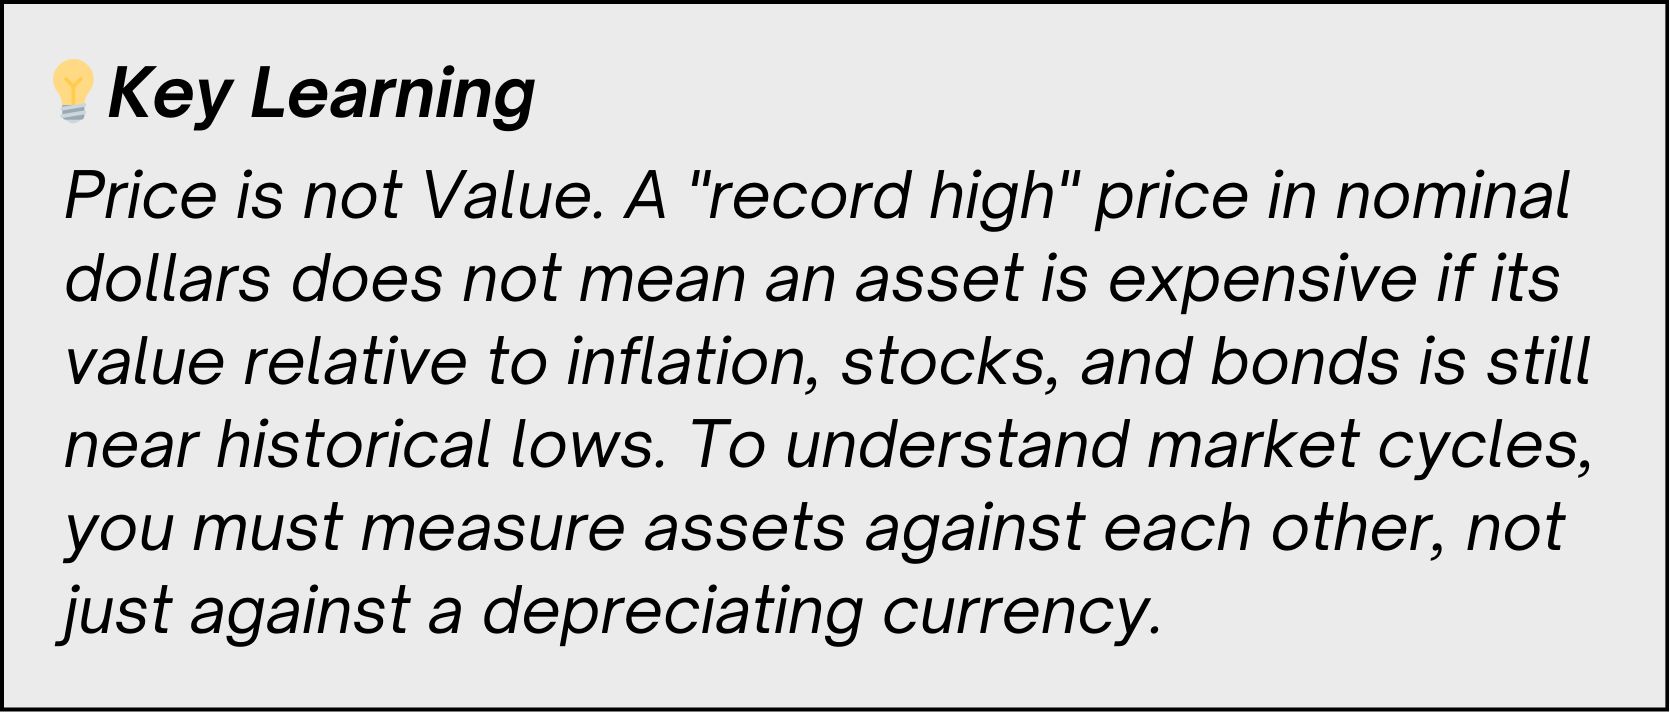
However, these views often ignore the massive structural shifts in long-term market cycles. When we stop looking at the price in isolation and start looking at relative value, a very different story emerges.
1. The Mirage of Nominal Highs
While the dollar price of Gold might be hitting record numbers, inflation-adjusted data tells a more humble story. If you compare Gold to cash (adjusted for inflation) since the 1980 peak, Gold has essentially just kept pace. In dollar terms, an investment in Gold today holds similar purchasing power to what it did during the 1980 spike.
Source : LSEG
It hasn't "skyrocketed"; it has simply recovered its value relative to the depreciating dollar.
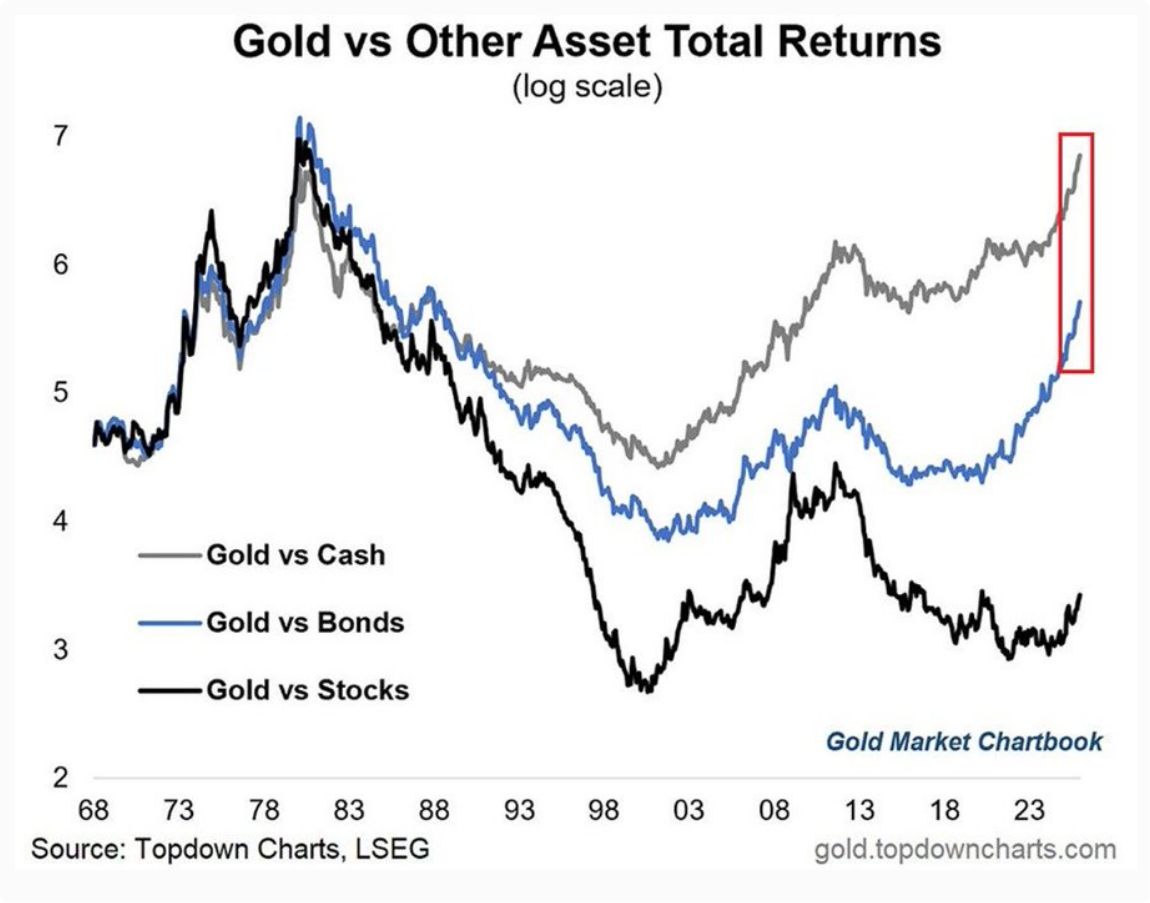
2. Gold vs. The Paper Giants (Stocks & Bonds)
The true potential of Gold is hidden in its ratio against other asset classes. When we look at the Gold-to-S&P 500 ratio or Gold vs. US Treasuries, the "expensive" argument falls apart:
Relative to Stocks: Gold is currently trading at a nearly 50% discount compared to its 1980 peak relative to the S&P 500. While stocks have surged over the decades, Gold's growth relative to equity markets is still lagging significantly.
Relative to Bonds: Compared to government bonds, Gold is still about 17% below its historical highs.
3. Why the "Top" is Hard to Find
Market participants have been calling a "top" at $2,000, $3,000, and even $4,000. Yet, the charts offer no technical indication that the cycle has peaked. If Gold were to replicate the magnitude of the 1970s–1980s rally relative to stocks and bonds, the current prices would be considered the "early stages" rather than the end.
4. The Long-Term Cycle View
The current rally isn't just a speculative bubble; it's a rebalancing of portfolios that have been overweight in paper assets (stocks/bonds) for decades. Until the Gold-to-Stock ratio returns to its historical mean or peak, the "potential energy" for Gold to move higher remains immense.
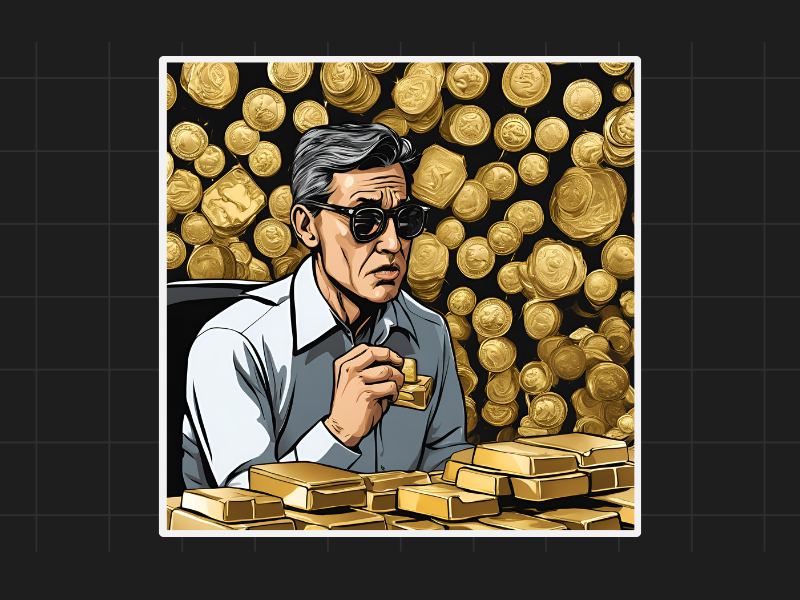
Meme Of The Day

Headline: Gold is at a nominal all-time high, but relative to the S&P 500, it is still 50% below its 1980 peak. What is your outlook? |

Share this daily insightful newsletter with your market savvy friends and family or sign them up for the newsletter !
For detailed blogs, reports and strategies, check WeekendInvesting.com
Reply