- WeekendInvesting
- Posts
- Why the World is Running Out of Liquid Gold
Why the World is Running Out of Liquid Gold
Above Ground vs. Below Ground
WeekendInvesting Analytics
December 31, 2025


Market Update - Wednesday, 31 Dec
As the final day of the year concludes, the market has delivered a decent performance, jumping up to end 2025 on a positive note.
Reflecting on the overall journey of 2025, there are many positive blessings to count. The stock markets have consolidated effectively over the last 15 to 16 months, suggesting that the environment is now nearer than farther from the next rally. Gold and silver performed exceptionally well during this calendar year, providing strong support to allocated portfolios. This period has reinforced the relevance of asset allocation for most market investors.
Additionally, real estate has continued to move along quite nicely. Overall, 2025 has removed much of the fluff and extreme hot money from the markets, making the landscape lean and mean for the path ahead. Consequently, 2026 is starting out on a very good note.
An analysis of the charts for the day shows Nifty up by 0.74 percent, placing it just a stone's throw away from a new all-time high.
Nifty Junior also saw a 1 percent jump, and a head and shoulders pattern is currently forming, which could lead to a very sharp move.
Mid-cap and small-cap indices also experienced jumps, with all indices closing above the two-day high middle, which is a strong indicator for positive short-term movement.
Small caps erased all losses from the previous four days, while Bank Nifty rose nicely by 0.69 percent.
In contrast, gold is looking down and is currently negative in the short and mid-term, though its long-term trend remains positive. There may be more room for gold to move lower before it trends upward again.
Silver is performing better than gold due to its recent run, though its short-term charts are not currently positive.
Other Market Triggers
The heat map was largely green, with only a few IT stocks and Bajaj Finance losing ground. Within the Nifty Next 50 heat map, Hindustan Zinc and Adani Power saw some downward movement, but the rest of the map remained green.
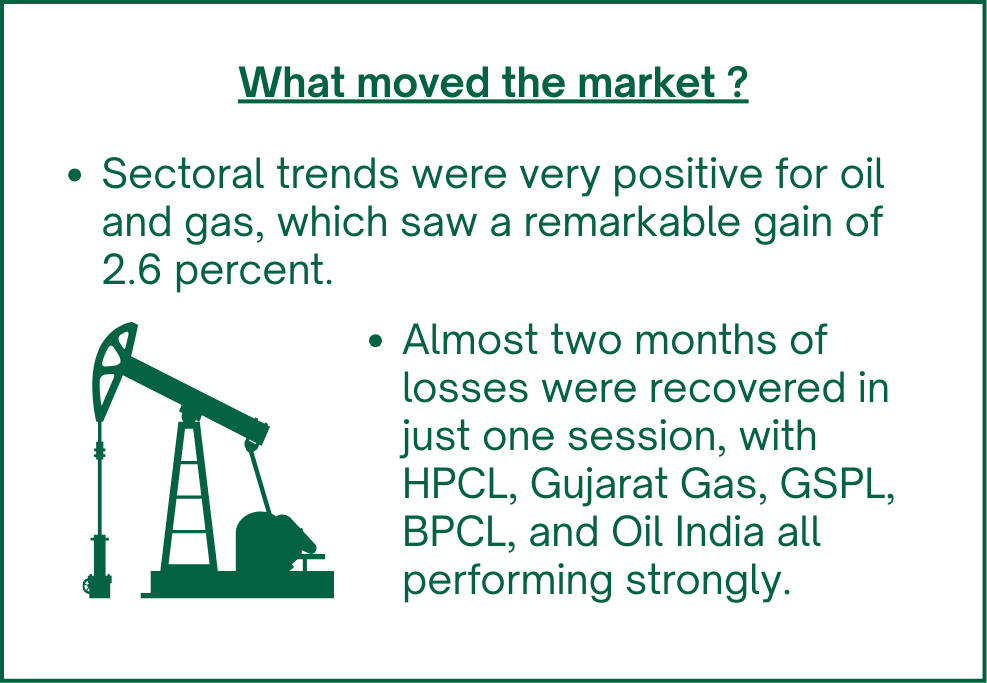
Oil and gas companies moved up rapidly, and Graphite emerged as the mover of the day with a 9 percent gain on heavy trading volume.
Graphite, along with HEG and Rain, are commodity-based stocks catching up quickly from recent bottoms.
US Market Updates
In the US markets, there were some downward moves recently. The Russell 2000 fell 0.8 percent, and the Dow Jones, NASDAQ 100, and S&P 500 also declined.
While many analysts predict a difficult year ahead for US markets, those predictions have not yet fully materialized. Stocks such as Palantir, Gilead, IBM, Tesla, and Goldman Sachs lost ground recently. It should be noted that some of these stocks may be included in Weekend Investing US strategies, so this information is not a recommendation.
Within the NASDAQ 100, Nvidia saw a marginal drop, while Apple, Google, and Microsoft remained quiet. Meta saw some gains while Tesla experienced losses.
What to watch next ?
A unique trend is visible in the gold futures market regarding the percentage change gap between current and next-series contracts on the MCX. While this gap is usually around 1 percent for a two-monthly cycle, the gap between the January and March contracts is currently between 2.5 and 3 percent.
This high rollover cost for gold longs suggests either a very high expectation for rising gold prices, a shortage of physical delivery in the market, or a potential warning sign that too many FOMO traders are entering the market. Silver does not currently show this same spread.
Get your Portfolio Momentum Report today and ensure your investments are positioned for success!

For more details about Category 3 AIFs, fill in the interest form below
Important Announcement
We are now live on our official WhatsApp Channel. We share all our strategy updates, rebalances, and important announcements here. Please watch this video to know more & join in at the earliest possible.
Top Trending Strategies
Mi EverGreenPower of Gold with Equity | Allocate 20 strongest CNX200 stocks with Gold ETF | Monthly Rebalanced Mi Evergreen is a dynamic strategy which aims to outperform the underlying benchmark CNX200. This index comprises 200 large and mid-cap names which are the top-quality stocks in the markets. This product is suitable for use in all stages of the market cycles as it is designed to invest in the strongest stocks in the pack at any point. Additionally, there is a permanent hedge of Gold available here.
| Mi AllCap GOLDA core strategy to allocate 25% each to Large Cap , Mid Caps, Small Caps & Gold Mi AllCap GOLD is a robust, rule-based core rotational strategy from the House of WeekendInvesting, curated to cover stocks in the CNX500 universe, designed to offer a balanced asset allocation and diversified wealth creation approach for compounding returns over long periods of time.
|

🪙 The Golden Crunch: Why the World is Running Out of Liquid Gold
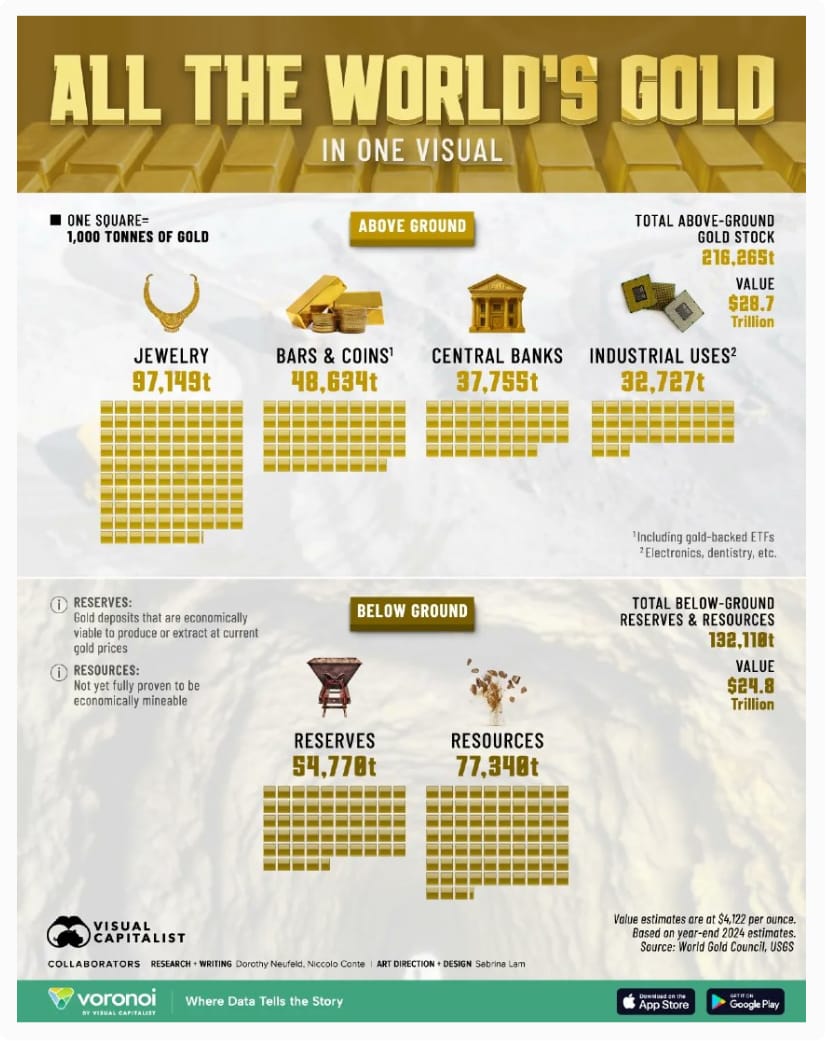
Have you ever wondered exactly how much gold exists in the world? A recent infographic by Visual Capitalist paints a startling picture of gold’s scarcity. It isn't just about what is in our vaults; it’s about how little is actually left to be found—and how even less is actually available for sale.
source : Visual Capitalist
The Great Divide: Above Ground vs. Below Ground
Currently, the world’s gold is split into two primary categories. The "Above-Ground" gold—the stuff already mined and sitting in vaults or jewelry boxes—amounts to roughly 216,000 tonnes. This represents a staggering value in the trillions of dollars.
However, the "Below-Ground" reserves tell a different story. While there are 132,000 tonnes still in the earth, only 54,000 tonnes are currently identified as "economically viable" to mine at today’s prices. The remaining 77,000 tonnes are buried so deep (2–3 kilometers under the crust) or are so difficult to extract that they won't be touched unless gold prices double or triple.
The Mining Bottleneck
Mining isn't as simple as digging a hole. As we exhaust easy-to-reach veins, miners are forced to go deeper, significantly increasing production costs. This creates a "balancing act":
If prices drop: Mining becomes unprofitable, mines shut down, and supply disappears.
If prices rise: Deep-earth resources become "viable," but bringing them to market takes years.
With a global annual production of only about 3,000–3,250 tonnes, the supply is essentially "inelastic"—it cannot be increased overnight, no matter how high the demand goes.
Who is Buying the World’s Supply?
The demand side is dominated by three massive "whales" that leave very little for the average retail investor:
China: Consumes approximately 900 tonnes annually.
India: Consumes between 800–900 tonnes annually (mostly for jewelry).
Central Banks: Traditionally bought 400 tonnes a year, but for the last three years, they have ramped up to nearly 1,000 tonnes per year.
The "Illiquid" Reality: Where is the Gold Hiding?
Even though 216,000 tonnes exist above ground, you can’t actually buy most of it. Effectively, only about 50,000 tonnes (the investment bars and coins) form the liquid market. When you compare this to the massive demand from nations and central banks, a supply squeeze is almost inevitable.
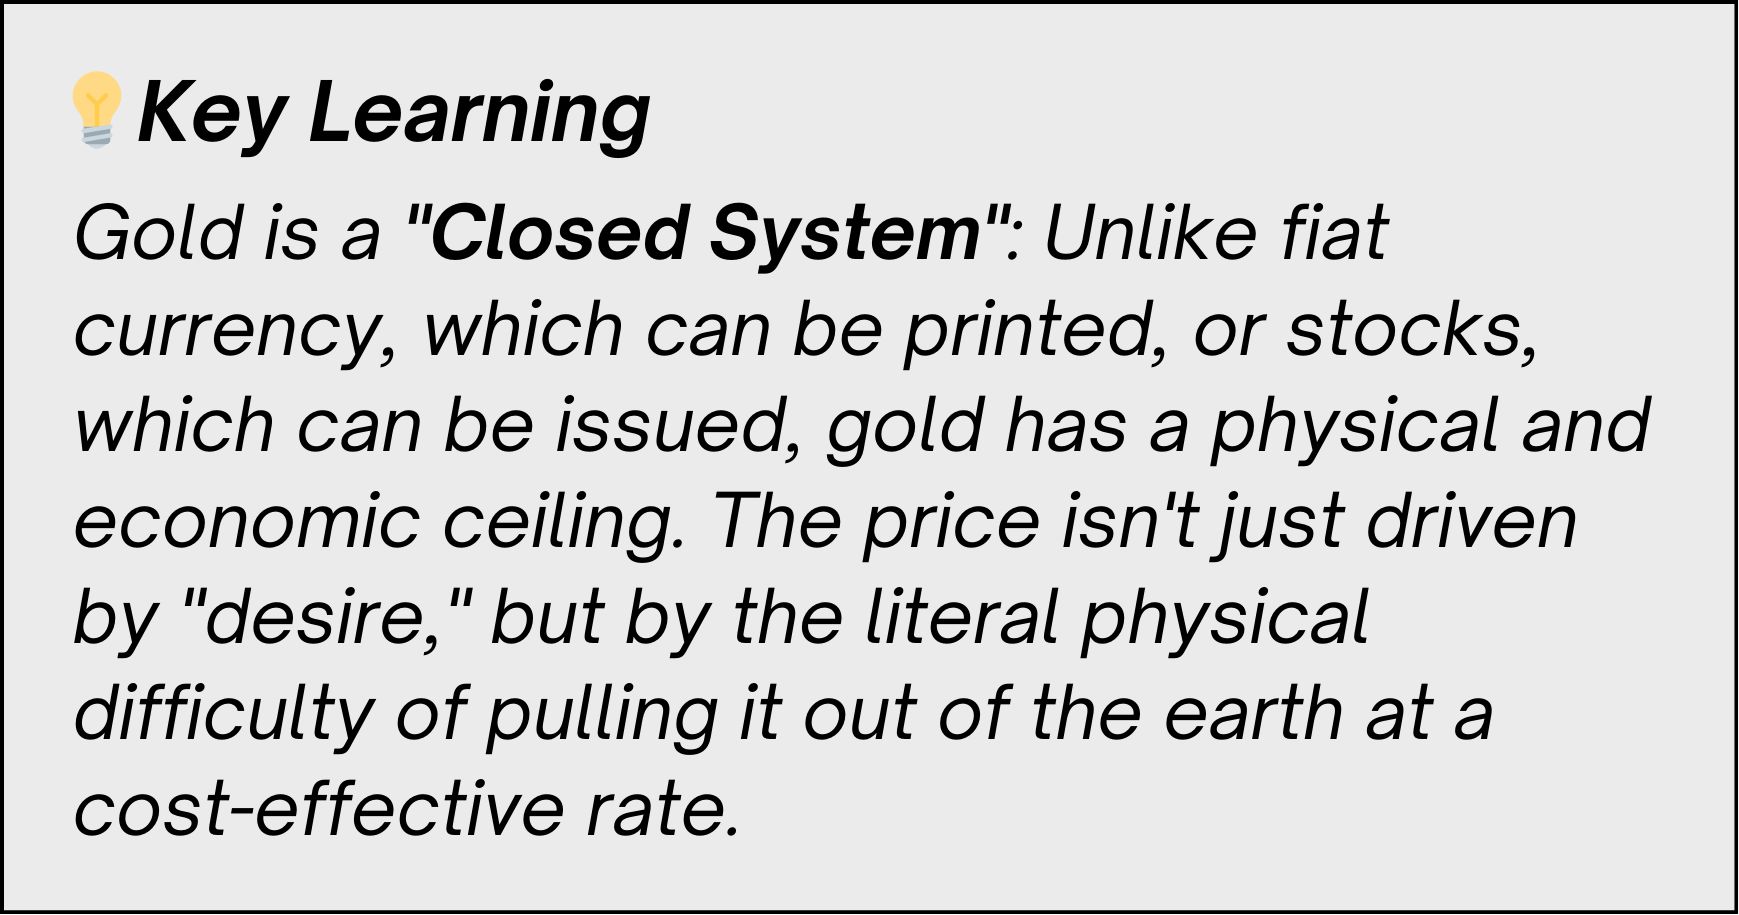
The Self-Correcting Price Equilibrium
The gold market has a built-in safety net. If the price falls, mining stops, creating an immediate shortage that pushes the price back up. This floor, combined with the 1-2% measly annual growth in supply, has allowed gold to deliver a 12% to 14% CAGR (Compound Annual Growth Rate) in the long term. It remains a rock-solid hedge against the volatility of the equity markets.
Meme Of The Day
Given that most of the world’s gold is locked away in jewelry or Central Bank vaults, how do you view Gold as part of your financial future? |

Share this daily insightful newsletter with your market savvy friends and family or sign them up for the newsletter !
For detailed blogs, reports and strategies, check WeekendInvesting.com
Reply