- WeekendInvesting
- Posts
- Why "Time in Market" Beats "Timing the Market"
Why "Time in Market" Beats "Timing the Market"
The Only Survival Guide You Need
WeekendInvesting Analytics
December 29, 2025

Market Update - Monday, 29 Dec
The final days of 2025 have arrived, and the market started the week on a somewhat steady note before collapsing as the day progressed. There is a noticeable lack of momentum to sustain current levels, and the market appears to slip lower whenever a lull occurs.
A significant point of discussion today involves the ratio chart between equities and gold. The market is reaching a junction where equities may start to look very favorable compared to gold, a trend that has repeated many times in history.
It is important to clarify that this does not necessarily mean gold will stop rising. Instead, it suggests that if the chart turns at this point, equities have the potential to grow at a faster pace than gold.

The Nifty has now closed lower for the fourth consecutive day, losing 0.38%. During this move, the market covered a previous gap, and while it remains uncertain if the market will head lower, the 25,940 level and the 26,000 mark have been broken once again.
Other indices followed a similar downward trajectory, with the Nifty Junior dropping 0.47%, mid-caps falling 0.4%, and small-caps decreasing by 0.53%.
The Nifty Bank saw a more marginal decline of 0.13%, contributing to a listless and sluggish market environment that failed to find a clear direction.
The commodities market also experienced significant pressure, with gold falling 1.09%.
However, the most dramatic action occurred in silver over the last two sessions. After an amazing move from 220 to 240 on Friday, silver opened near 255 or 260 this morning before being completely smashed down within a single hour.
This volatility is surrounded by various rumors, including potential export bans from China or issues regarding bank stability.

Other Market Triggers
The Nifty heat map was predominantly red. While Tata Steel, Asian Paints, and Tata Consumer managed some gains, there was a notable sell-off in IT, energy, and PSU stocks, along with Bharti Airtel.
The Nifty Next 50 also suffered broad losses. Commodities were hit hard, with Vedanta and Zinc seeing declines.
Even IRFC, which had a strong run on Friday, was pushed down. Within that segment, only IOC and BPCL managed to trade in the green.
In terms of individual movers, Mishra Dhatu Nigam Ltd (Midhani) stood out with a 10% gain, jumping as high as 12% during the day. This move was fueled by expectations surrounding an upcoming defense meeting where Midhani is likely to bag new orders.
US Market Updates
Previous sessions in the US markets were marginally down or flat. Notable stocks that continued to run included Target, Nike, UnitedHealth, 3M, and Nvidia.
Within the NASDAQ 100, Nvidia, AVGO, ASML, Netflix, and Palantir moved higher, while Tesla, Meta, and MU faced downward pressure. These observations serve as a general market overview rather than specific investment recommendations.
What to watch next ?
While this week might see a lack of significant movement, there is an estimate that activity will pick up by the end of the week.
It is noted that several top banks hold short positions in silver and are facing margin issues.
Exchanges have significantly increased margin requirements, leading to forced position liquidations for both buyers and sellers.
Such violent moves, like a 10% swing over two days, often signal an intermediate top, suggesting the asset may cool off in the short to medium term.
Get your Portfolio Momentum Report today and ensure your investments are positioned for success!

For more details about Category 3 AIFs, fill in the interest form below
Important Announcement
We are now live on our official WhatsApp Channel. We share all our strategy updates, rebalances, and important announcements here. Please watch this video to know more & join in at the earliest possible.
Top Trending Strategies
Mi EverGreenPower of Gold with Equity | Allocate 20 strongest CNX200 stocks with Gold ETF | Monthly Rebalanced Mi Evergreen is a dynamic strategy which aims to outperform the underlying benchmark CNX200. This index comprises 200 large and mid-cap names which are the top-quality stocks in the markets. This product is suitable for use in all stages of the market cycles as it is designed to invest in the strongest stocks in the pack at any point. Additionally, there is a permanent hedge of Gold available here.
| Mi AllCap GOLDA core strategy to allocate 25% each to Large Cap , Mid Caps, Small Caps & Gold Mi AllCap GOLD is a robust, rule-based core rotational strategy from the House of WeekendInvesting, curated to cover stocks in the CNX500 universe, designed to offer a balanced asset allocation and diversified wealth creation approach for compounding returns over long periods of time.
|

📈 The Survival Guide: Why "Time in Market" Beats "Timing the Market"
Today, we want to share some incredibly interesting data spanning the last 100 years. History isn't just a record of the past; it is a roadmap for your financial future.
🏛️ A Century of Chaos: The Timeline of Turmoil
If you feel like the world is constantly in crisis, you aren’t wrong. Every decade for the last century has faced a "market-killing" event. Look at this timeline:
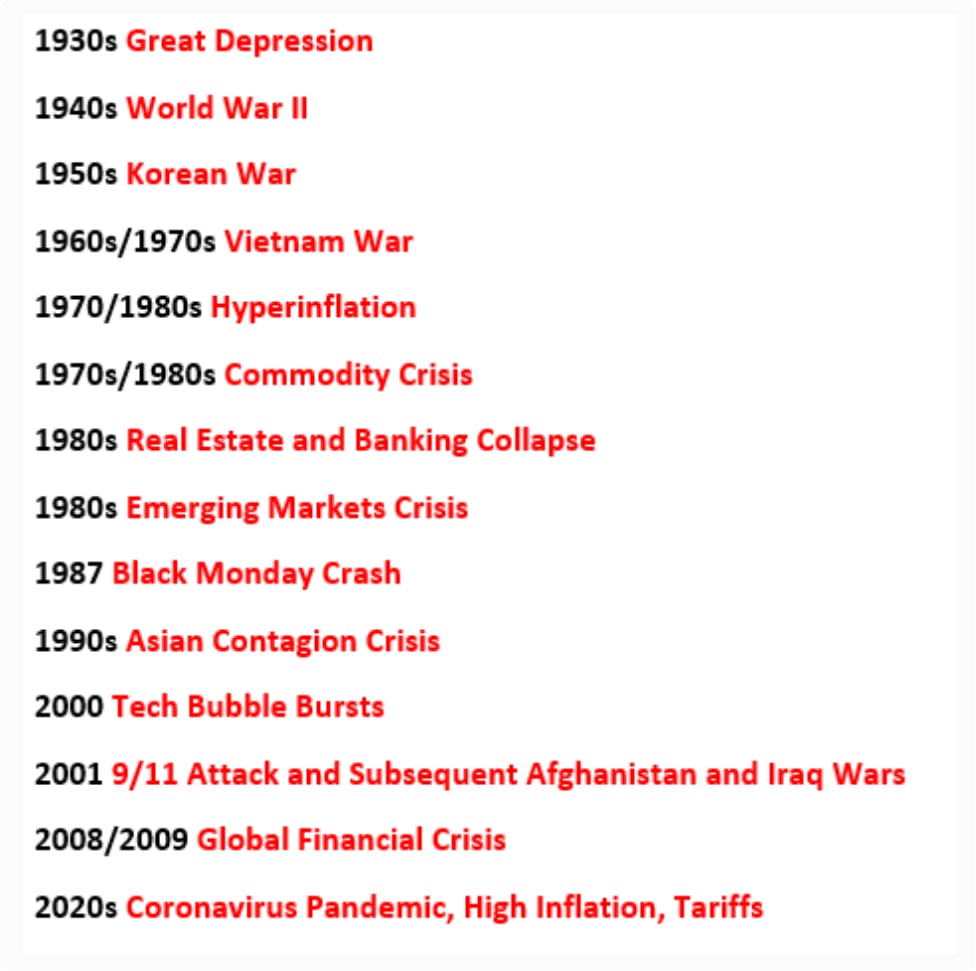
Source : Peter Mallouk on X
The Pattern: Approximately once every decade, the market takes a massive hit.
🚪 The Exit Trap: Why Most Investors Lose
When these "hits" happen, most people panic. They see their portfolio in red and decide, "This market isn't for me," or "I’m not cut out for this." They exit at the bottom.
However, every crash is followed by a "Fresh Wave." New investors enter when prices are low, and they often see massive gains within the first 1–2 years of recovery. Meanwhile, the veteran investors who panicked and left are stuck on the sidelines, missing the rally and struggling to find a re-entry point.
🔄 Adaptability: The Secret to Staying Power
Staying in the market is only half the battle; you must also ensure your portfolio can evolve.
If you hold direct stocks, there is a risk that the specific companies you own may never recover after a crash. This is where professional services or rule-based investing comes in:
Mutual Funds & PMS: Professional management to pivot through crises.
Momentum Funds: These are designed to automatically "exit weakness and enter strength."
By using strategies that adapt to market conditions, you ensure that you aren't just holding "dead wood" after a market correction.

Meme Of The Day
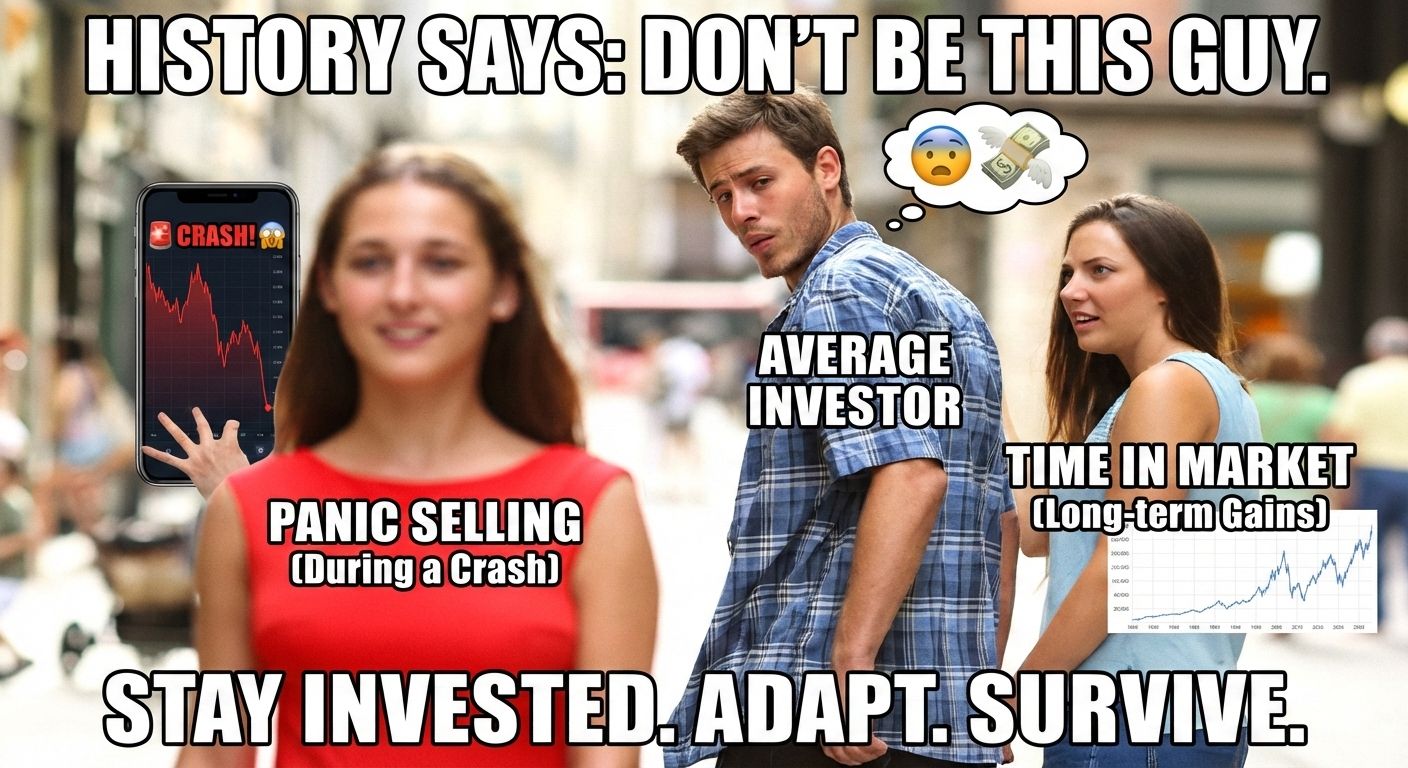
Headline: The market just dropped 20% in a week. What is your first reaction? |

Share this daily insightful newsletter with your market savvy friends and family or sign them up for the newsletter !
For detailed blogs, reports and strategies, check WeekendInvesting.com
Reply