- WeekendInvesting
- Posts
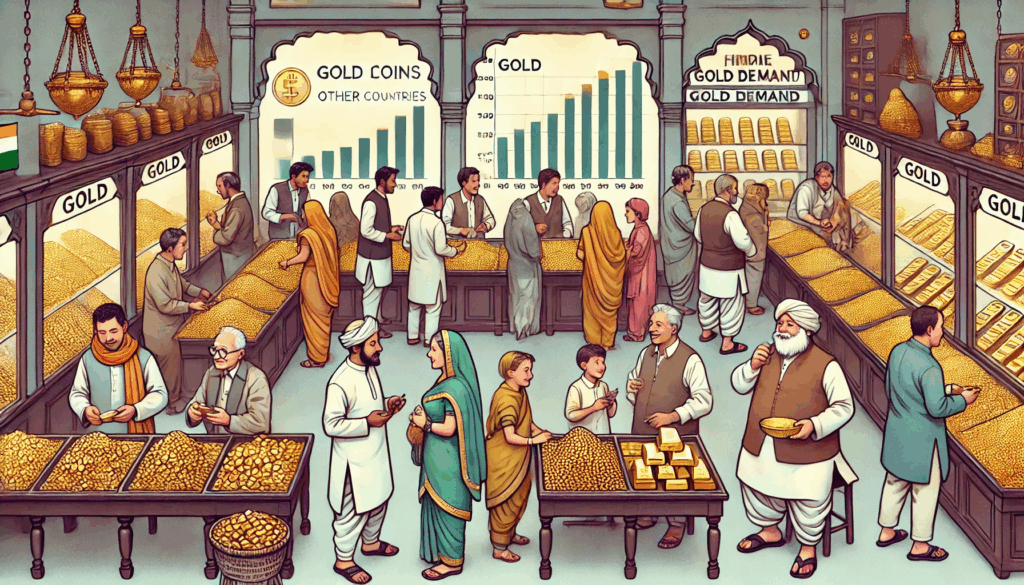
- Why Your Gold Is Worth 10% More Today! 🚀💰

Market Update - Wednesday, 13 May
The government has recently announced an increase in duties on gold and silver, raising them to 15% from the previous rate of 6%. This move represents a significant policy reversal, as the finance minister had reduced these duties from 15% to 6% in 2024. Looking further back to 2022, the rate had also been increased to 15% at that time. This frequent "policy flip-flop" every couple of years serves as a…
As of May 13th, the broader market showed signs of hesitation. While the Nifty held its ground near 23,582, it eventually gave up most of its gains, closing flat at 0.14%. This suggests that the current downtrend remains intact, and today’s movement was likely a "dead cat bounce" following four days of losses.
Other indices performed slightly better, with the Nifty Next 50 rising 0.85%, mid-caps up 0.6%, and small-caps up 0.29%.
Conversely, the Nifty Bank continued to struggle, dropping 0.18%.
In the commodities space, crude oil remained flat with a minor dip of 0.4%, as global attention shifts from conflict toward diplomatic and trade meetings between the US and China.

Other Market Triggers
The Nifty heat map revealed a mixed bag of results. Metals and some pharma stocks saw gains, while the auto and IT sectors continued to face pressure.
Within the Nifty Next 50, the Adani Group, commodities, oil marketing companies, and capital goods showed positive movement.
A notable performer was the Steel Authority of India Limited (SAIL), which surged 14% to approach its 18-year high last seen in 2008.This serves as a reminder of the long cycles in equity markets, as it has taken nearly two decades for the stock to return to those levels.
Meanwhile, Idea rose 8% following new fundraising news, though it remains within a long-standing price range.
U.S. Market Updates
In the US markets, several high-performing tech and semiconductor stocks faced a sharp correction.
Qualcomm fell 11%, Intel dropped 6.8%, and companies like Oracle, Salesforce, and ServiceNow saw declines of over 3%.
The Nasdaq and Russell indices both fell by nearly 1%, while the S&P and Dow Jones remained flat. It is important to view these falls in context: the Nasdaq is still up 12.4% for the month and 36% over the last year, suggesting these are small corrections within a larger rally. Some of these stocks are featured in the company's US stock strategies, which track the semiconductor and AI spaces.
What to watch next ?
Regarding gold investment, a unique arbitrage opportunity has emerged in Sovereign Gold Bonds (SGBs). While the calculated price for 10 grams stands at 1.66 lakhs and MCX futures trade at 1.63 lakhs, many SGBs are trading at 1.59 lakhs.
This discount exists because the sudden 9% duty hike has not yet been fully absorbed by the market. Short-term traders and high liquidity in the delivery market are preventing prices from rising immediately.
Over time, as the festive and marriage seasons approach, this gap is expected to close, and premiums may return. For long-term investors, SGBs currently offer a notable discount compared to the calculated market price.

Forwarded this email? Subscribe Now
Trending Strategy


📈 The "52-Week High" Paradox: Why Buying the Peak Beats Buying the Dip
We often hear the phrase "buy low, sell high." It sounds like the golden rule of investing. But what if the data suggests that buying high is actually the secret to even higher returns?
Today, we’re diving into a scientific study covering 20 years of US market data. The results might just change how you look at your portfolio.
The Strategy: Proximity to the Peak
The study categorized stocks into buckets (quintiles) based on one specific metric: How close is the stock price to its 52-week high?
Group A (Winners): Stocks trading at or very near their yearly highs.
Group B (Laggards): Stocks trading at a significant discount (far away) from their 52-week highs.
While "Value Investors" often hunt in Group B looking for bargains, the "Scientific Paper" referenced by The Chart Report shows a startling performance gap.

Source : The Chart report on X
The numbers don't lie. Over a two-decade horizon in the US markets, the performance delta between the "strong" and the "weak" was massive.
Imagine two paths over 20 years:
Path 1 (The High-Flyers): $10,000 grows to approximately $67,275.
Path 2 (The Bottom-Fishers): $10,000 grows to only approximately $14,570.
Why Does This Happen?
This is a classic "Proof of the Pudding" for Momentum Investing. Stocks hitting 52-week highs are usually doing so for a reason—strong earnings, institutional backing, or industry tailwinds. Conversely, stocks trading far from their highs often have "broken" fundamentals, making them "value traps" rather than "value buys."
💡 Key Learning
The Trend is Your Friend: The biggest takeaway is that price strength attracts more strength. In the stock market, "expensive" stocks often continue to get more expensive because they represent the highest quality companies with the most growth potential.
Meme Of The Day


Share this daily insightful newsletter with your market savvy friends and family or sign them up for the newsletter !
For detailed blogs, reports and strategies, check WeekendInvesting.com
Reply